Overview
Company: Piano Analytics — analytics platform used by major publishers and media companies worldwide.
Product: Metric Builder — a fullscreen modal for creating custom metrics using formulas, segments, and aggregation functions.
Role: Sole Product Designer. Worked with Product Owner, PM, and developers.
Timeline: 1 month.
The Problem
The existing Metric Builder was outdated and limiting. Users couldn’t apply segments to grouped metrics in parentheses, there were no aggregation functions (Min, Max, Average…), no multi-select, and complex formulas were hard to read.
User feedback and support tickets confirmed: power users were hitting walls daily.
Key Design Decisions
The redesign focused on five core areas: visual formula language, segment management, aggregation functions, multi-select, and drag & drop.
Previous version — flat formula view with limited functionality
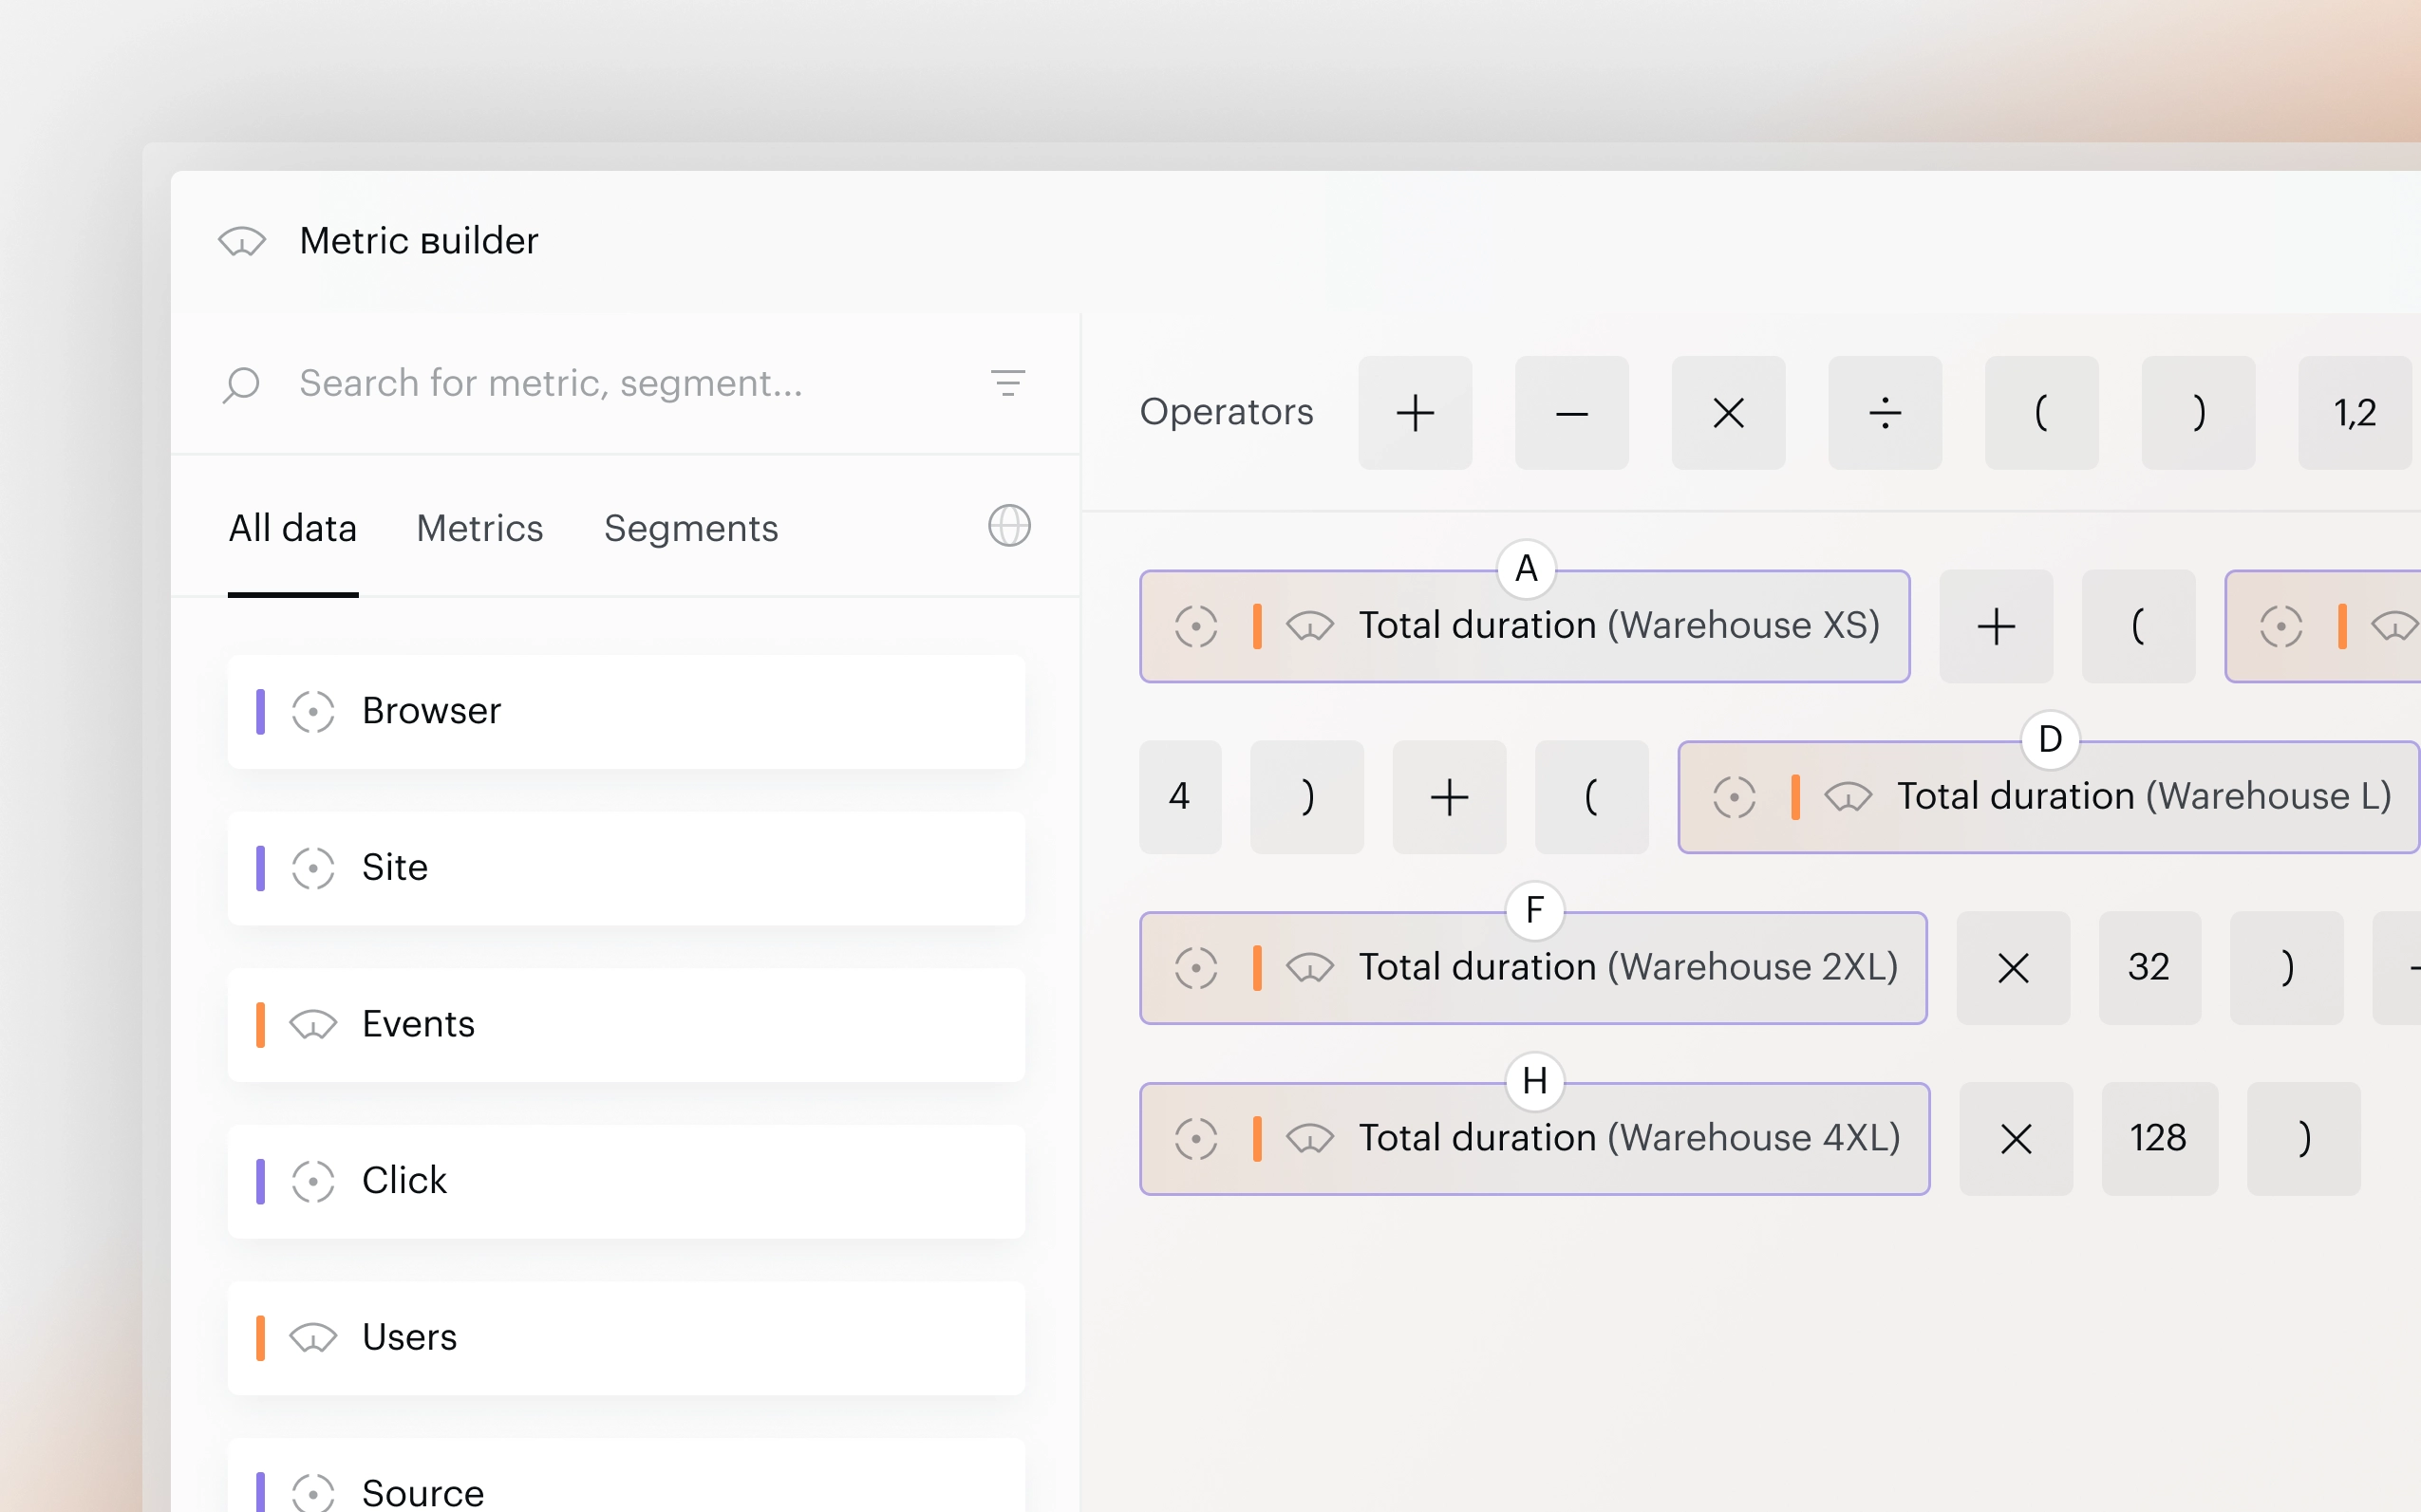
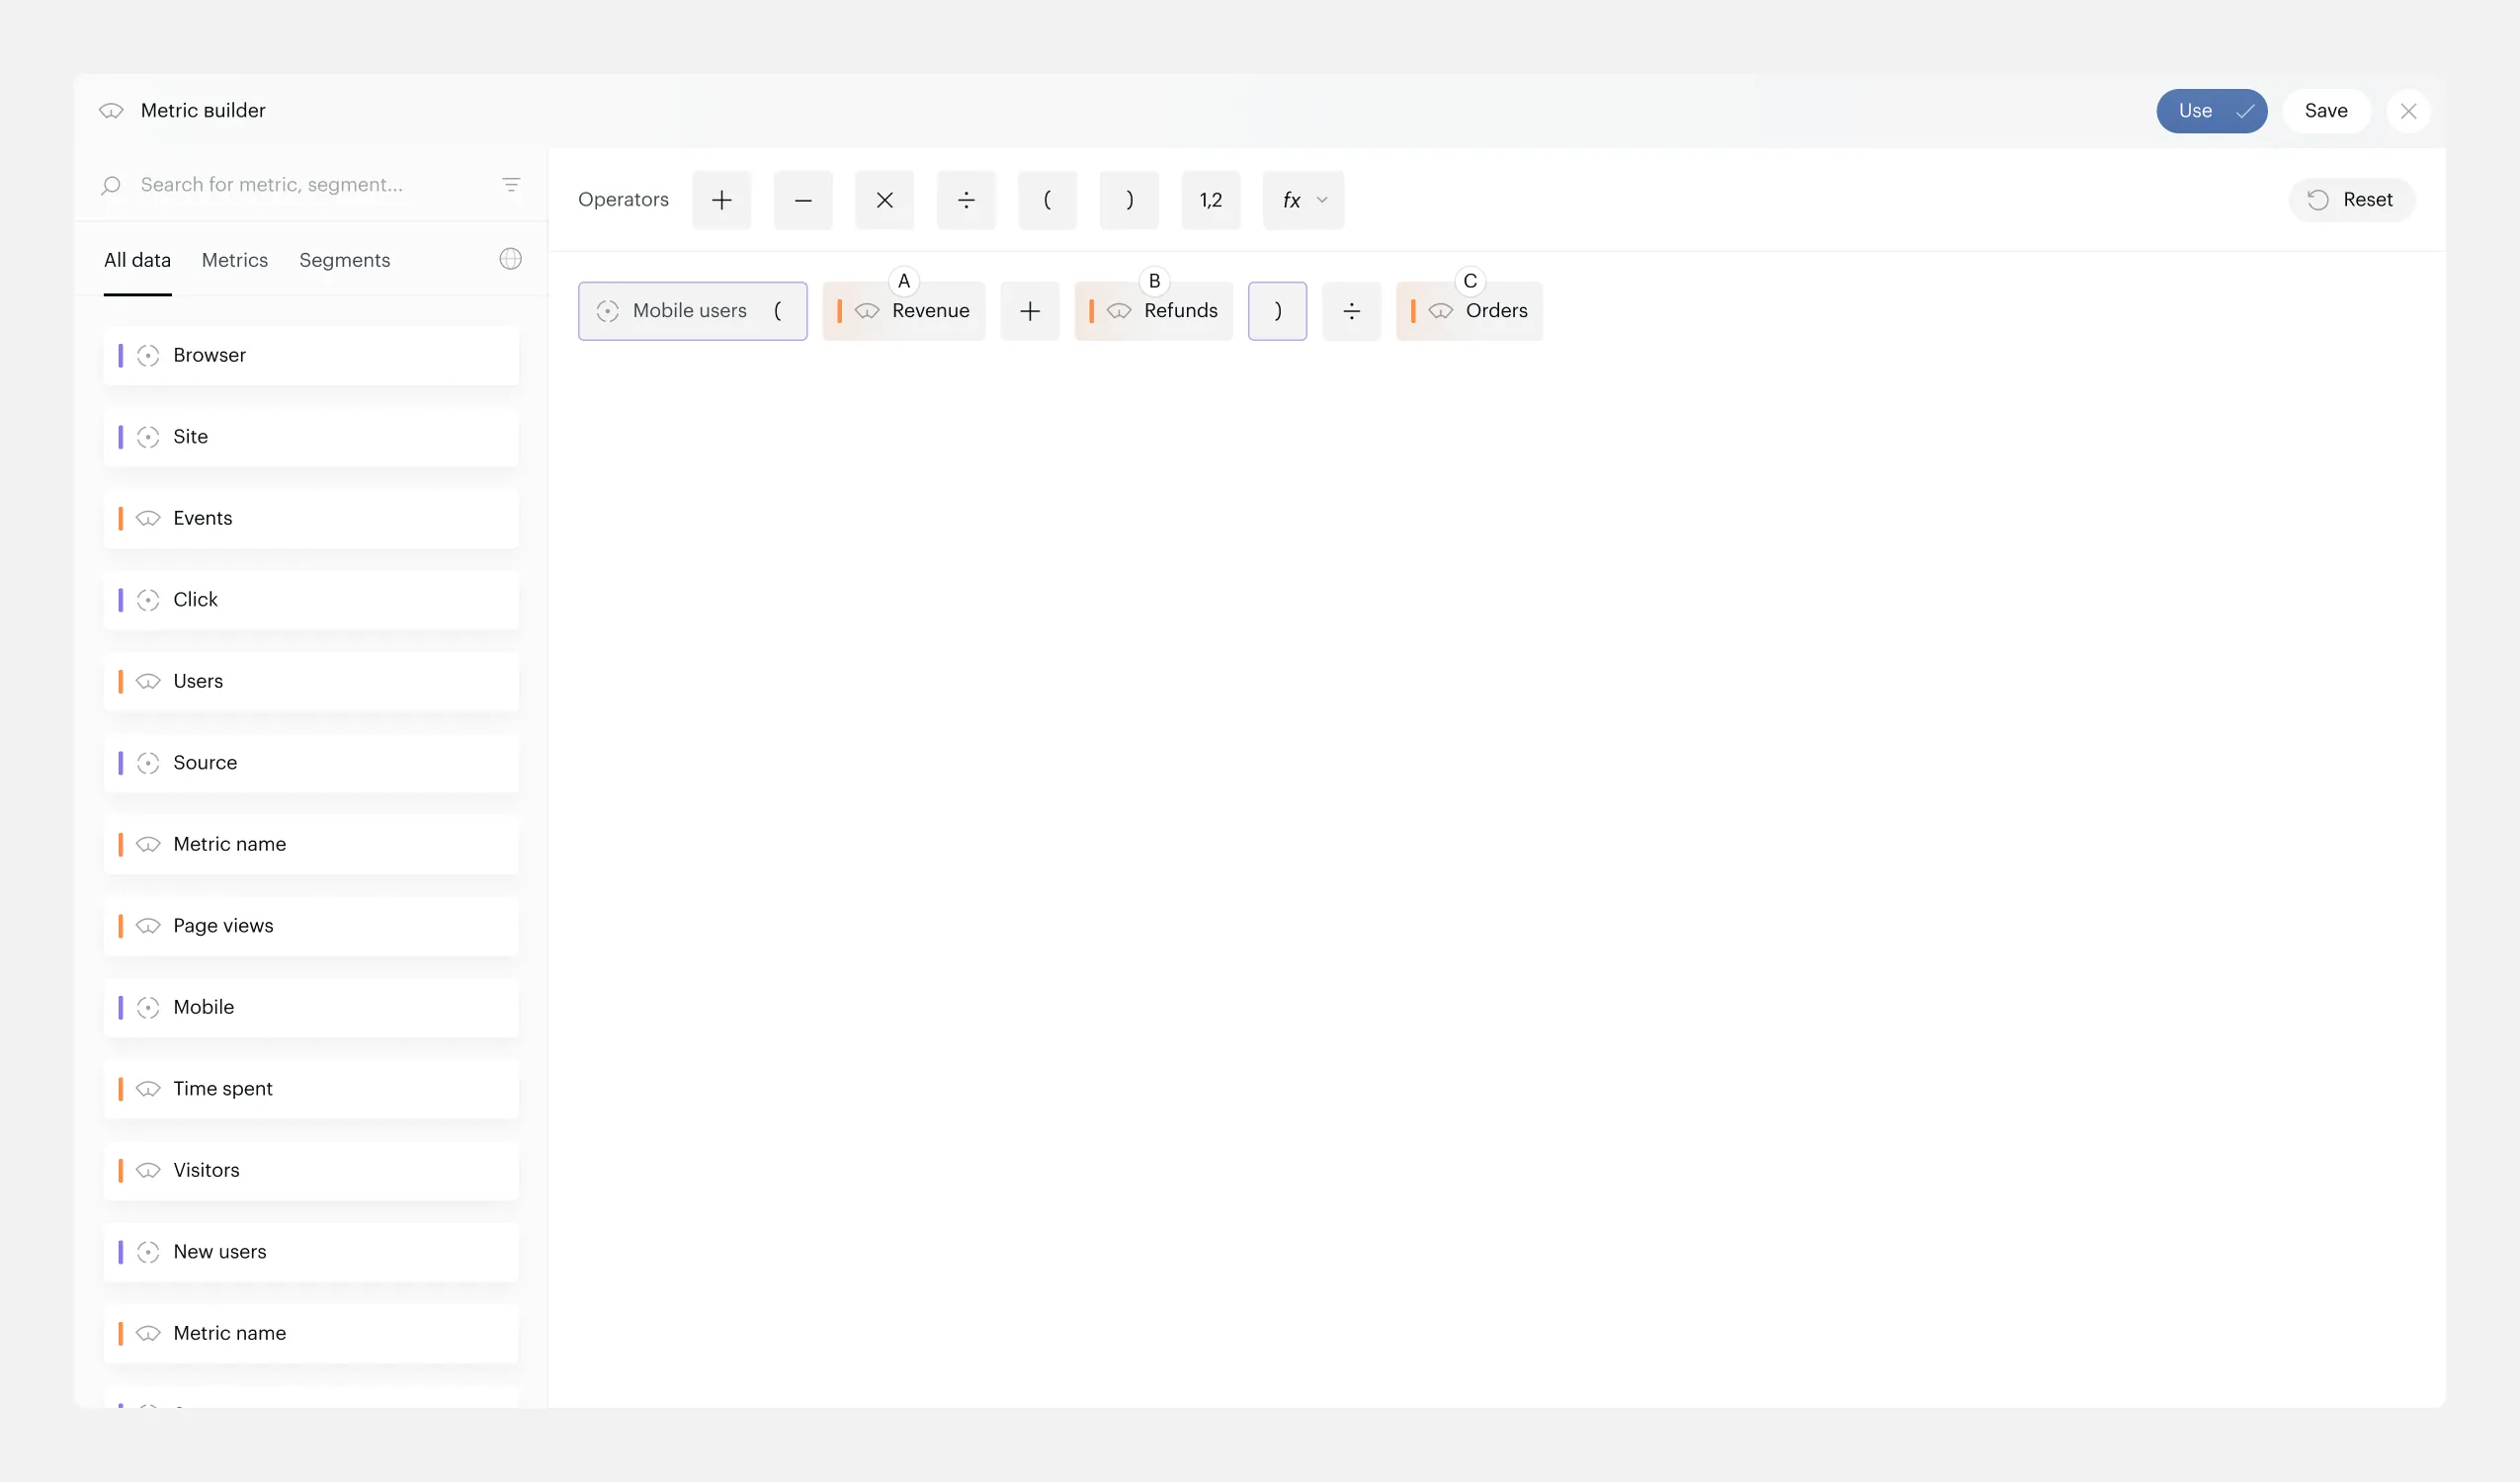
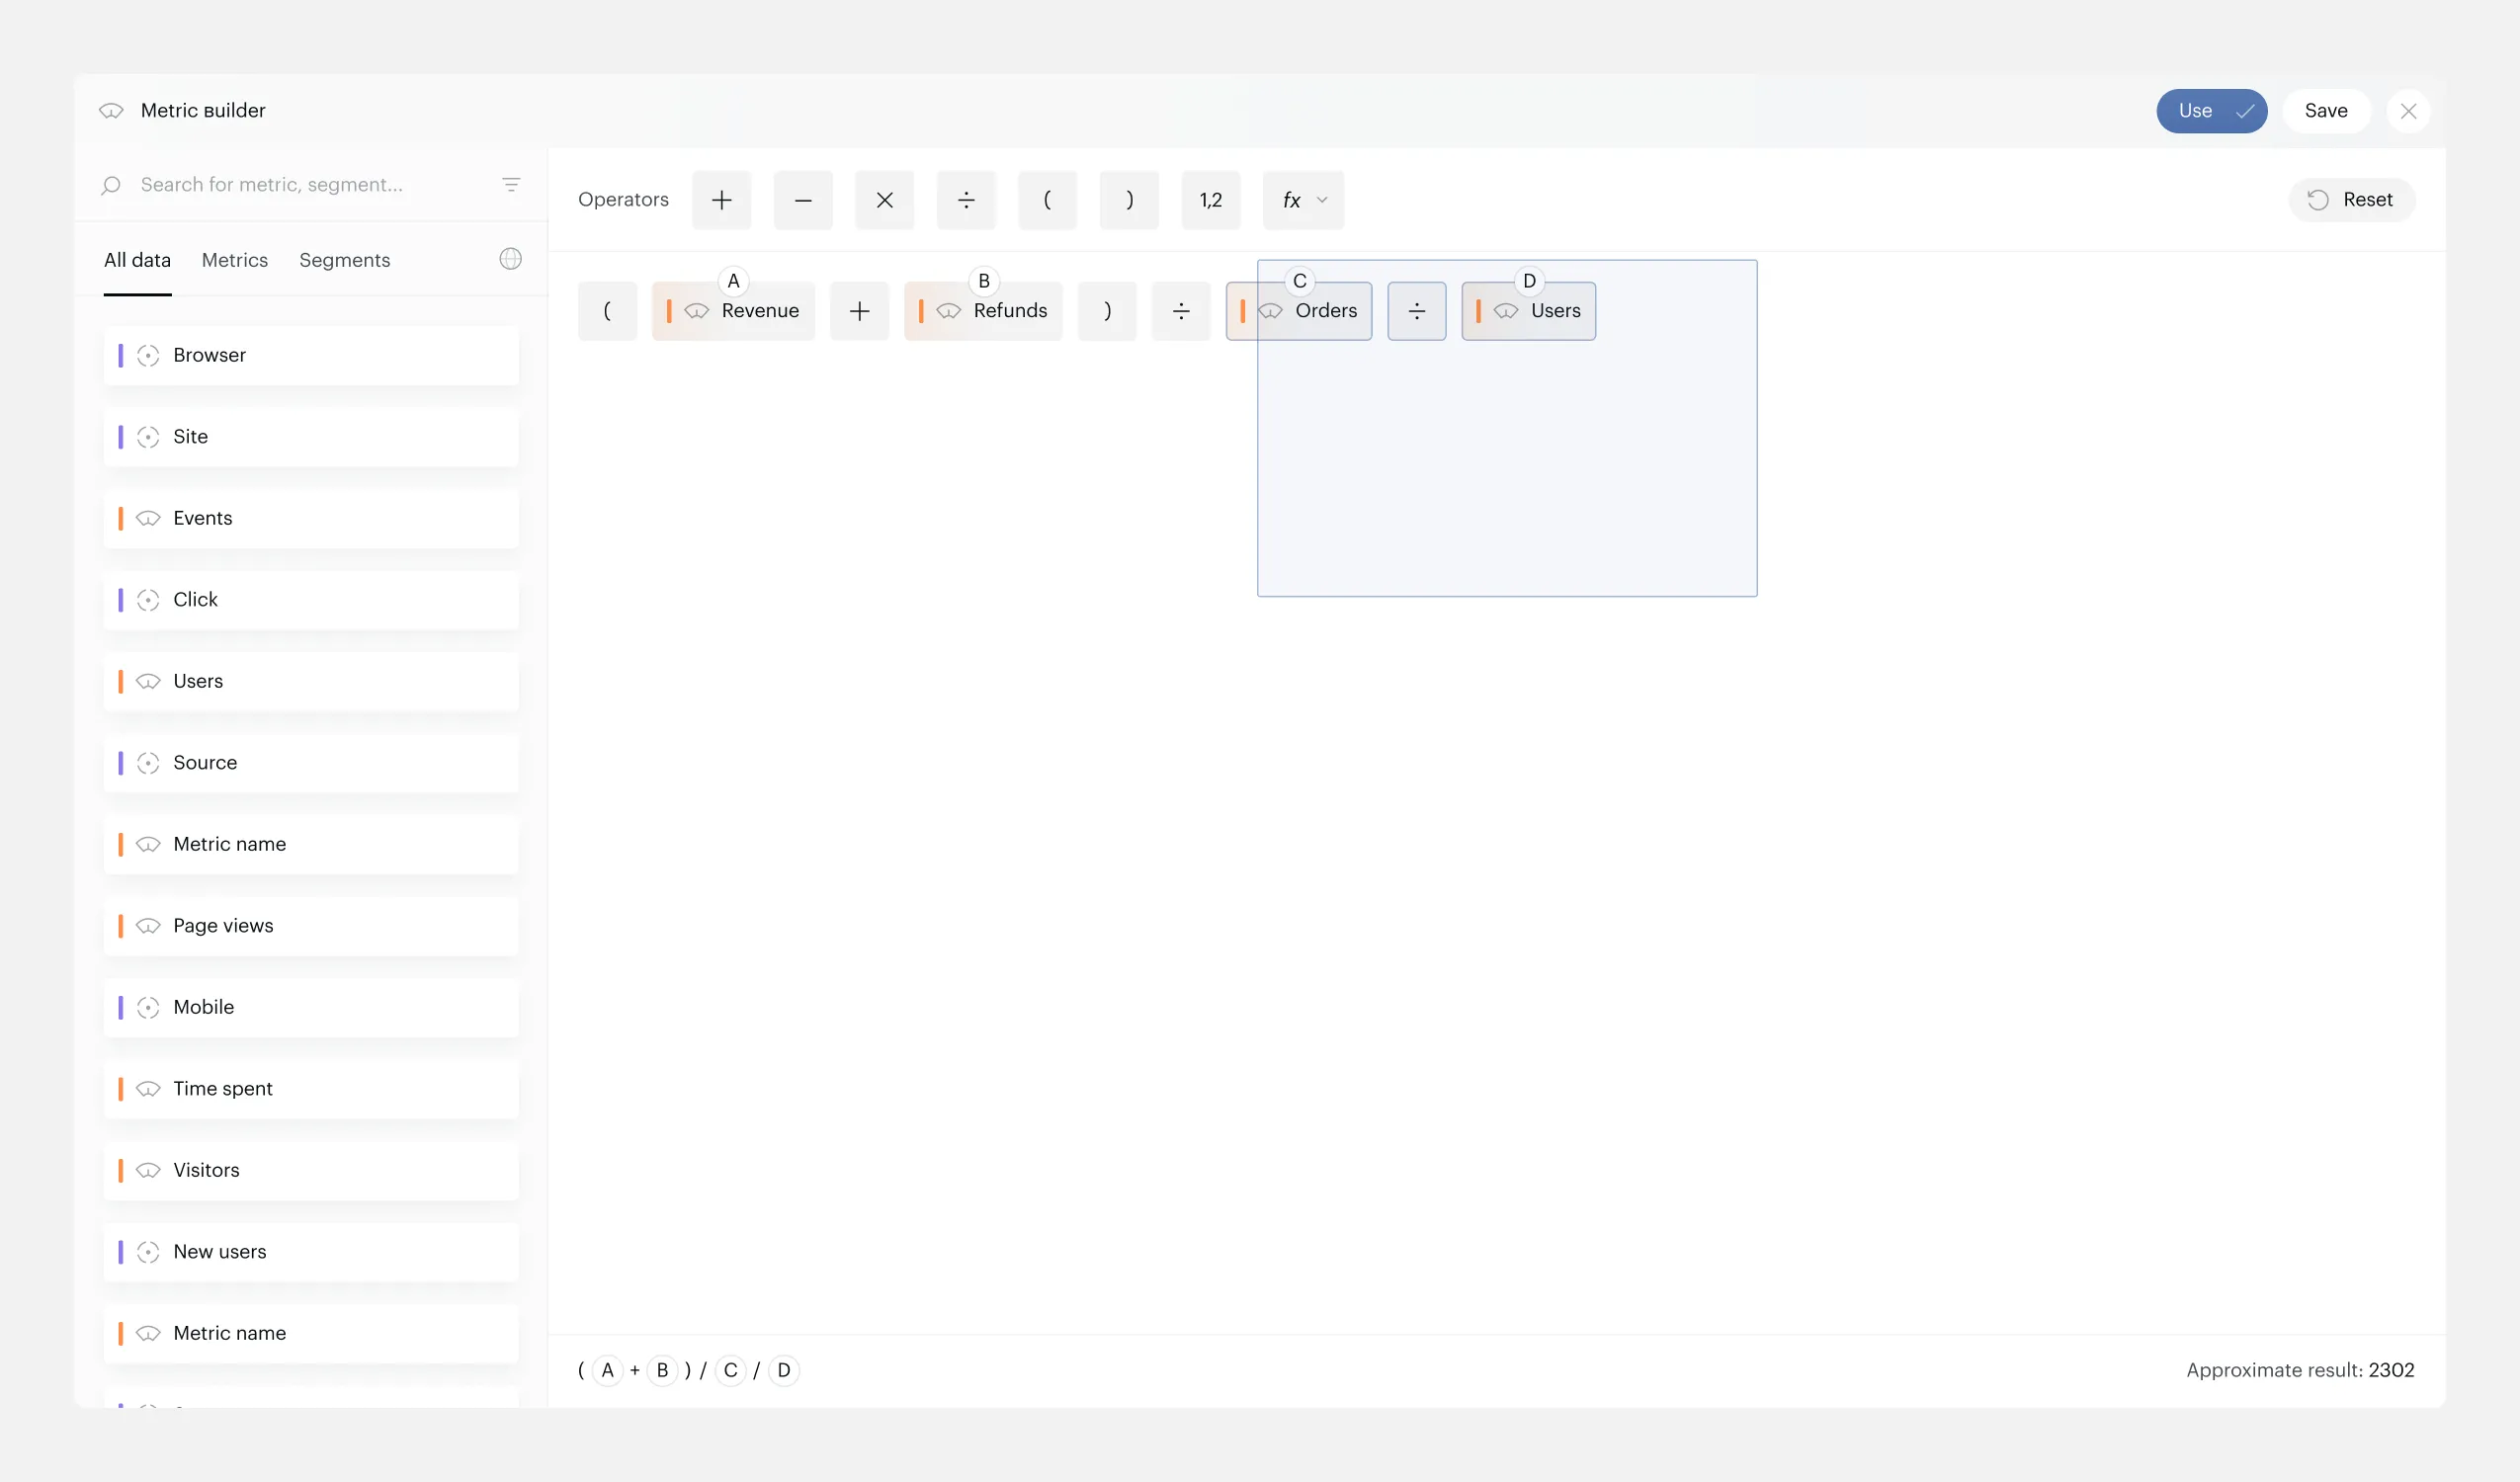
Formula Canvas with Visual Coding
Each element type has its own color: orange for metrics, blue for properties, purple for segments. Every metric chip shows an icon, a letter identifier (A, B, C), and its name. The bottom of the canvas displays a simplified formula (A + B ÷ C) for quick reading.
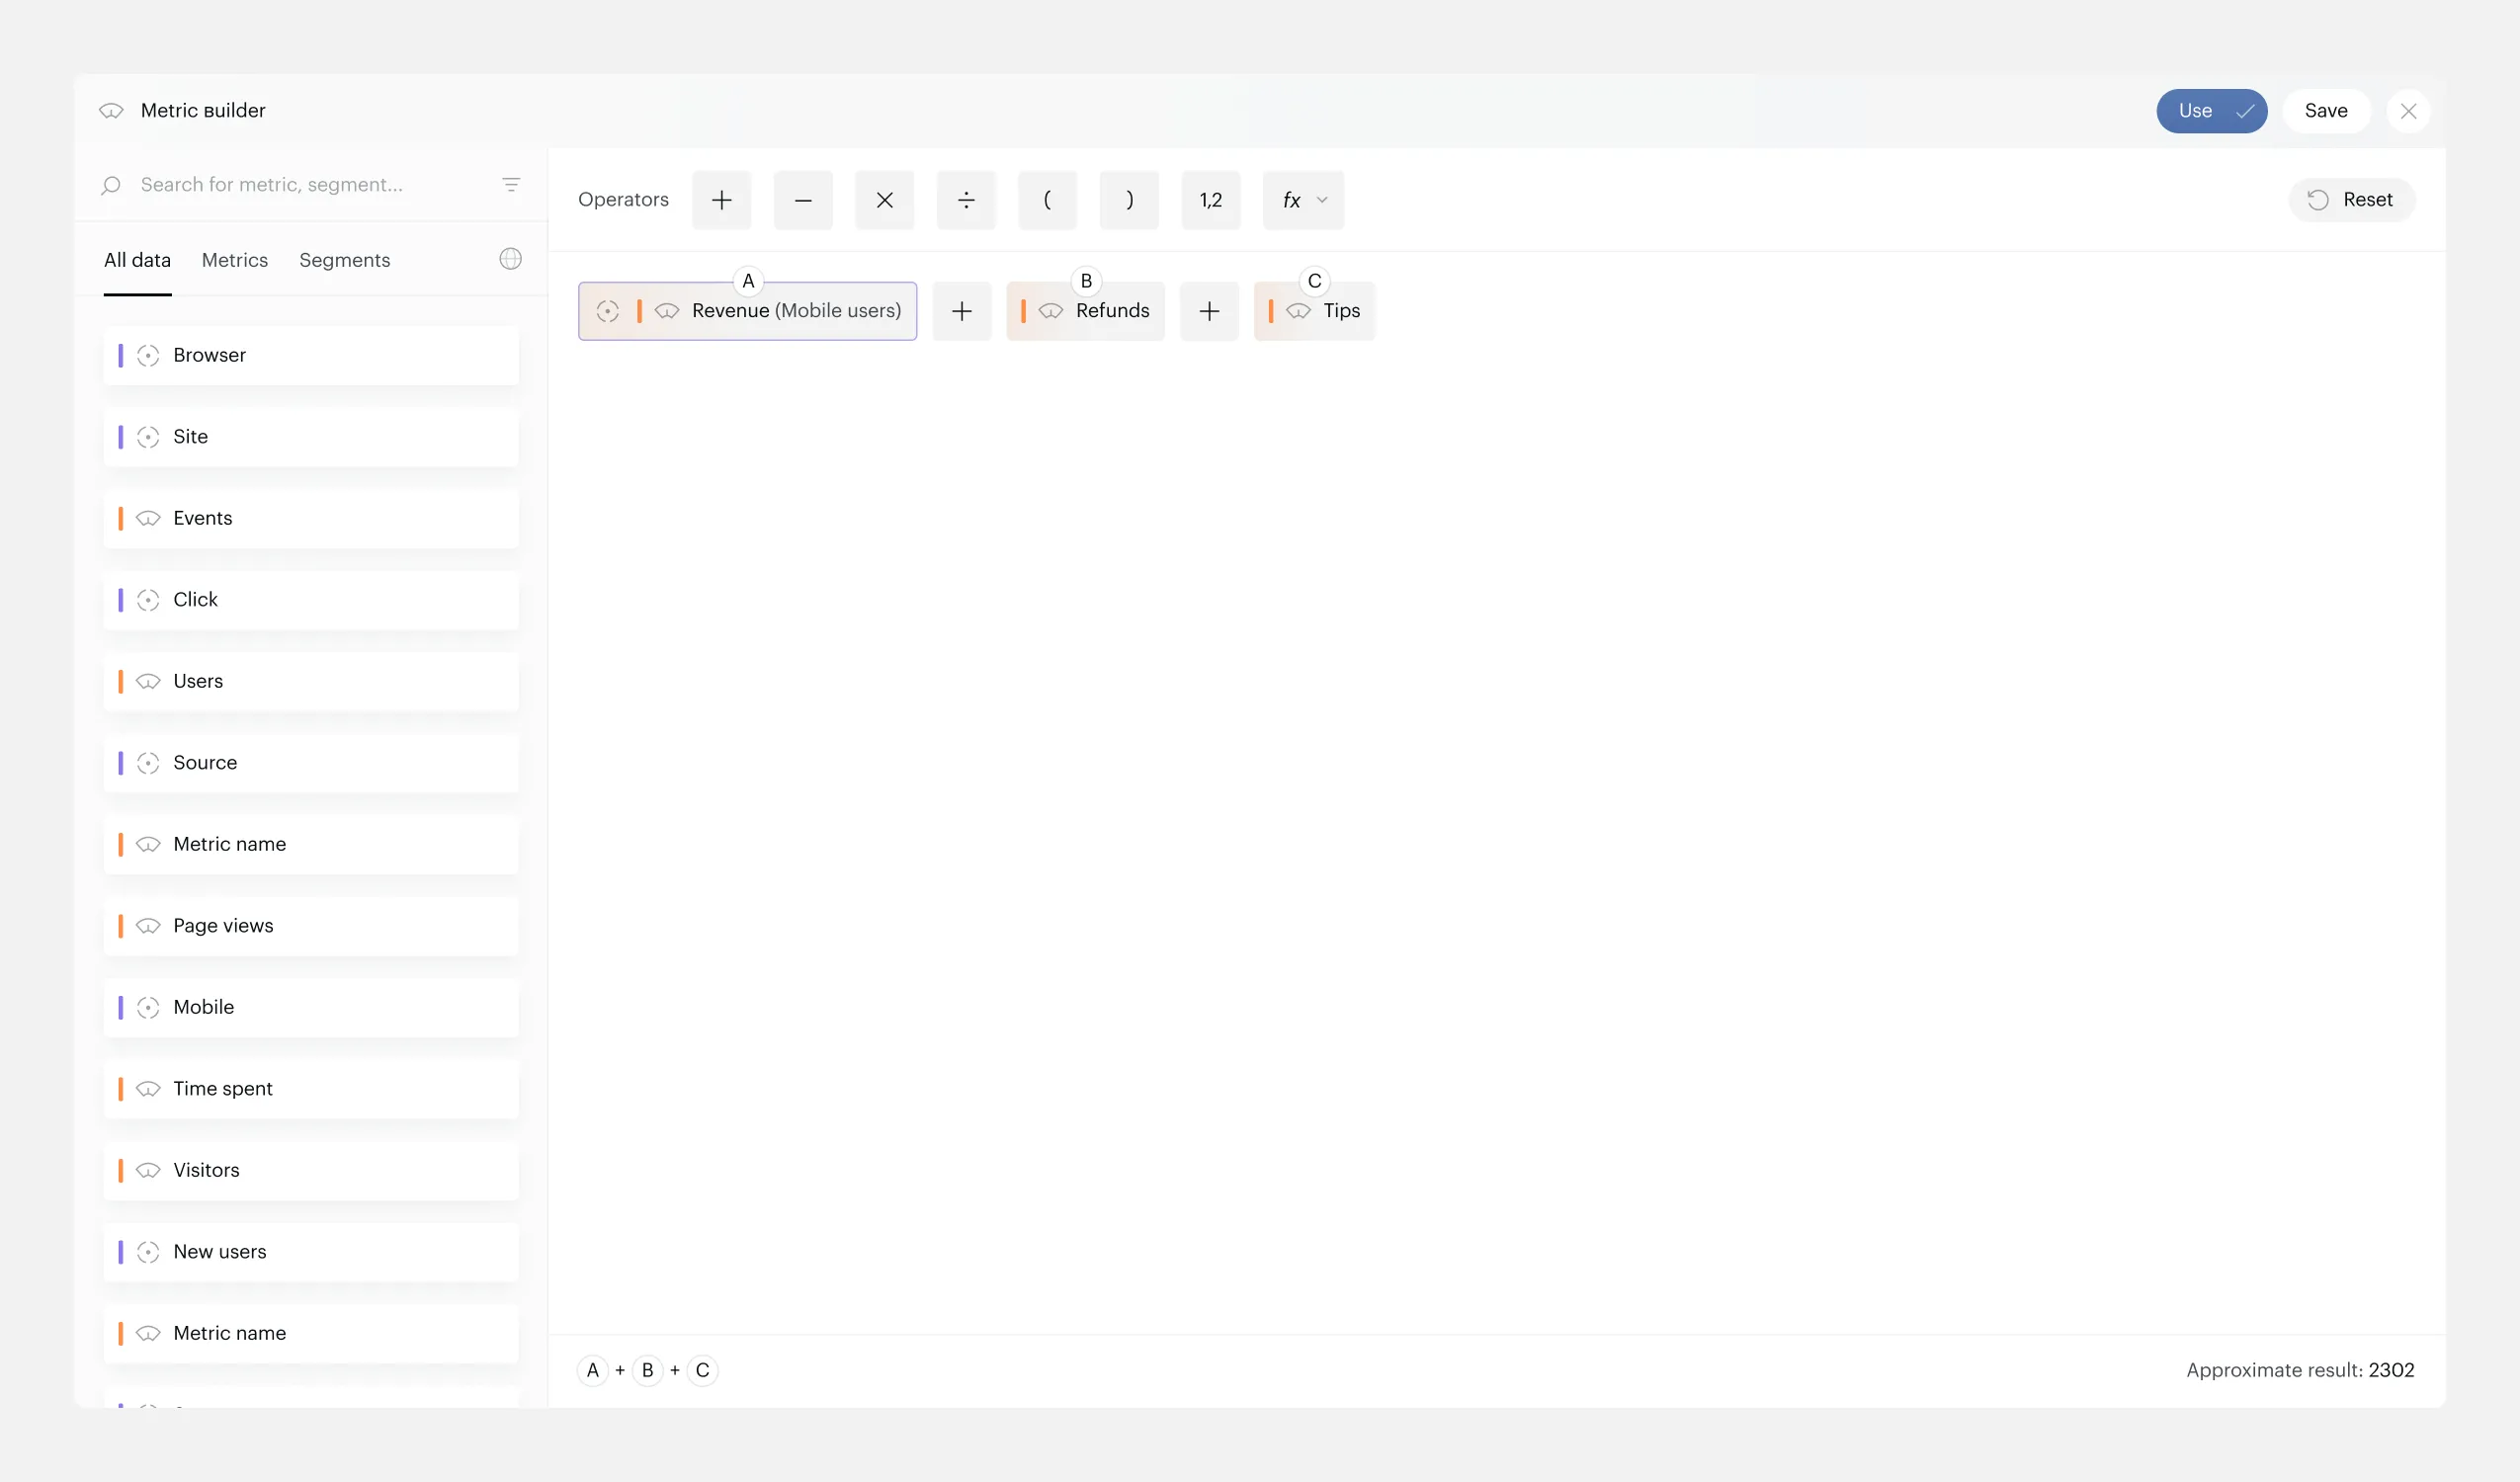
Formula canvas — color-coded chips with simplified formula below
Segments on Parentheses
The biggest missing feature. Parentheses are now clickable — click to apply a segment to everything inside. When applied, brackets turn purple with the segment name visible.
Conflict handling was the hardest part: if a metric inside already has a segment, the system warns before replacing. If brackets have a segment, individual metrics inside are locked with a tooltip explaining why.
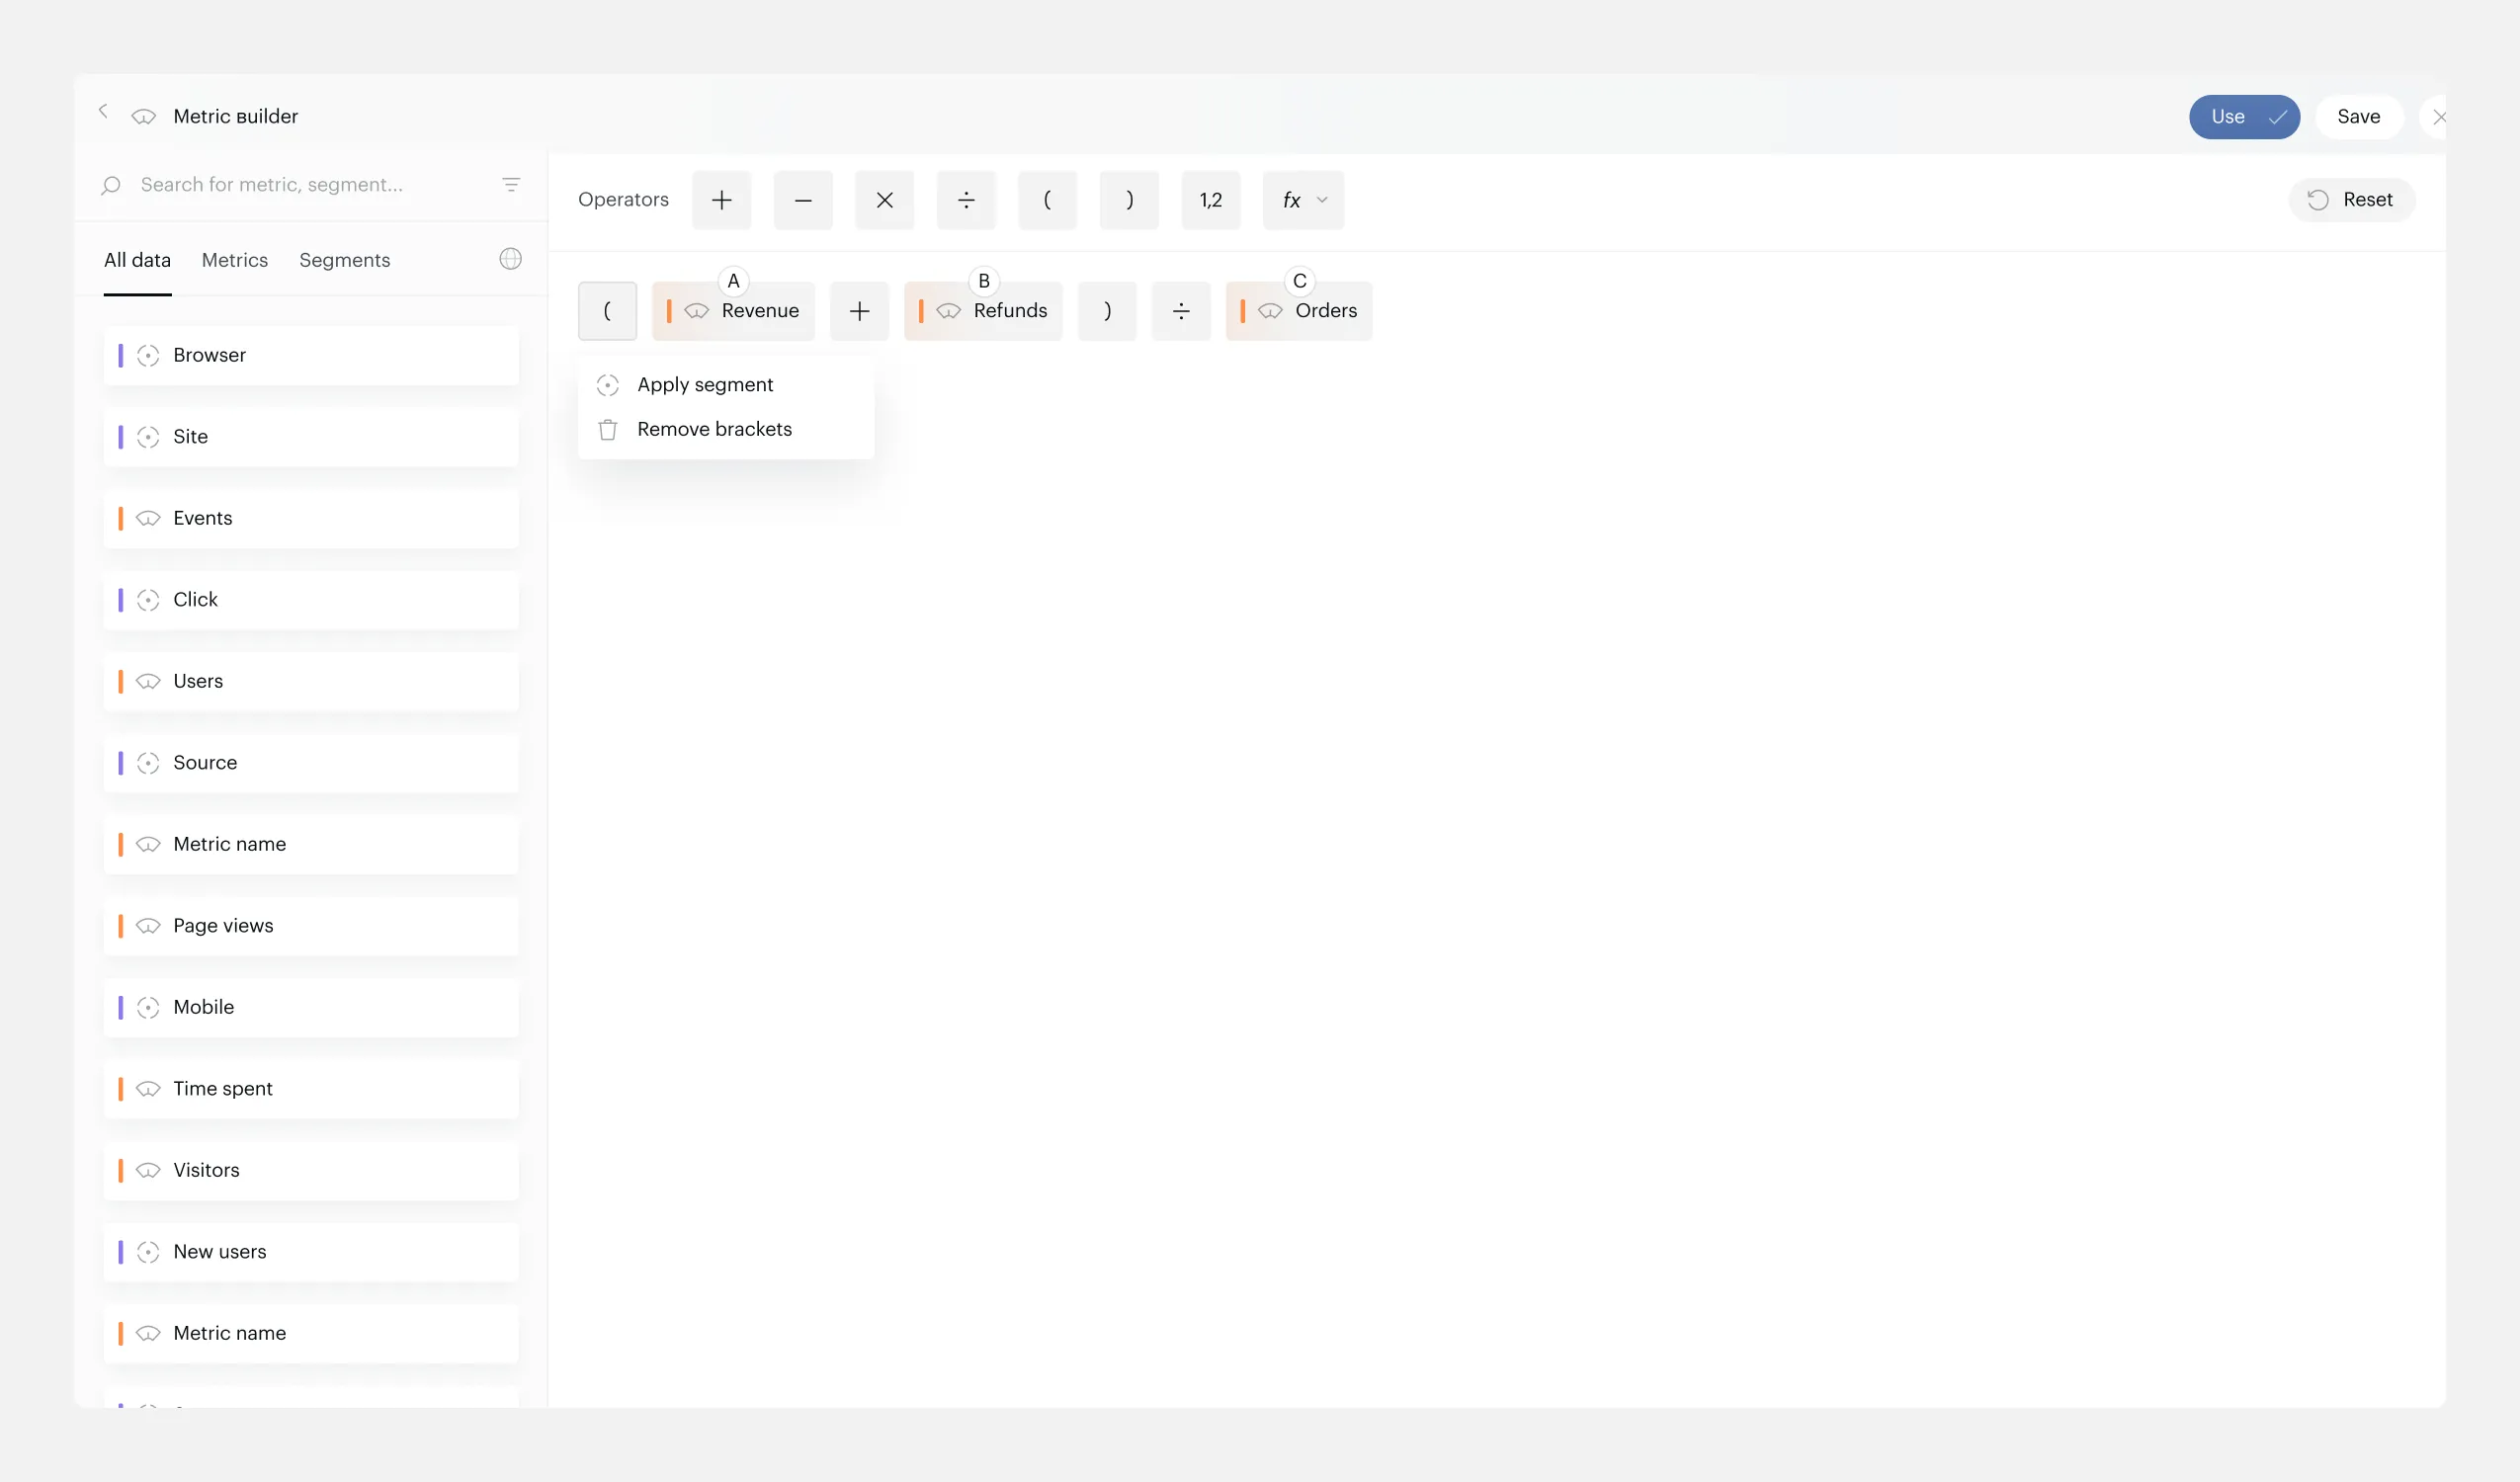
Click on parenthesis — popup to apply a segment
Segment applied — purple brackets with segment name visible
Aggregation Functions
New function chips (Min, Max, Sum, Average, Median) work as wrappers — pick a function, apply a property, get a metric. Added via a dropdown in the operator toolbar.
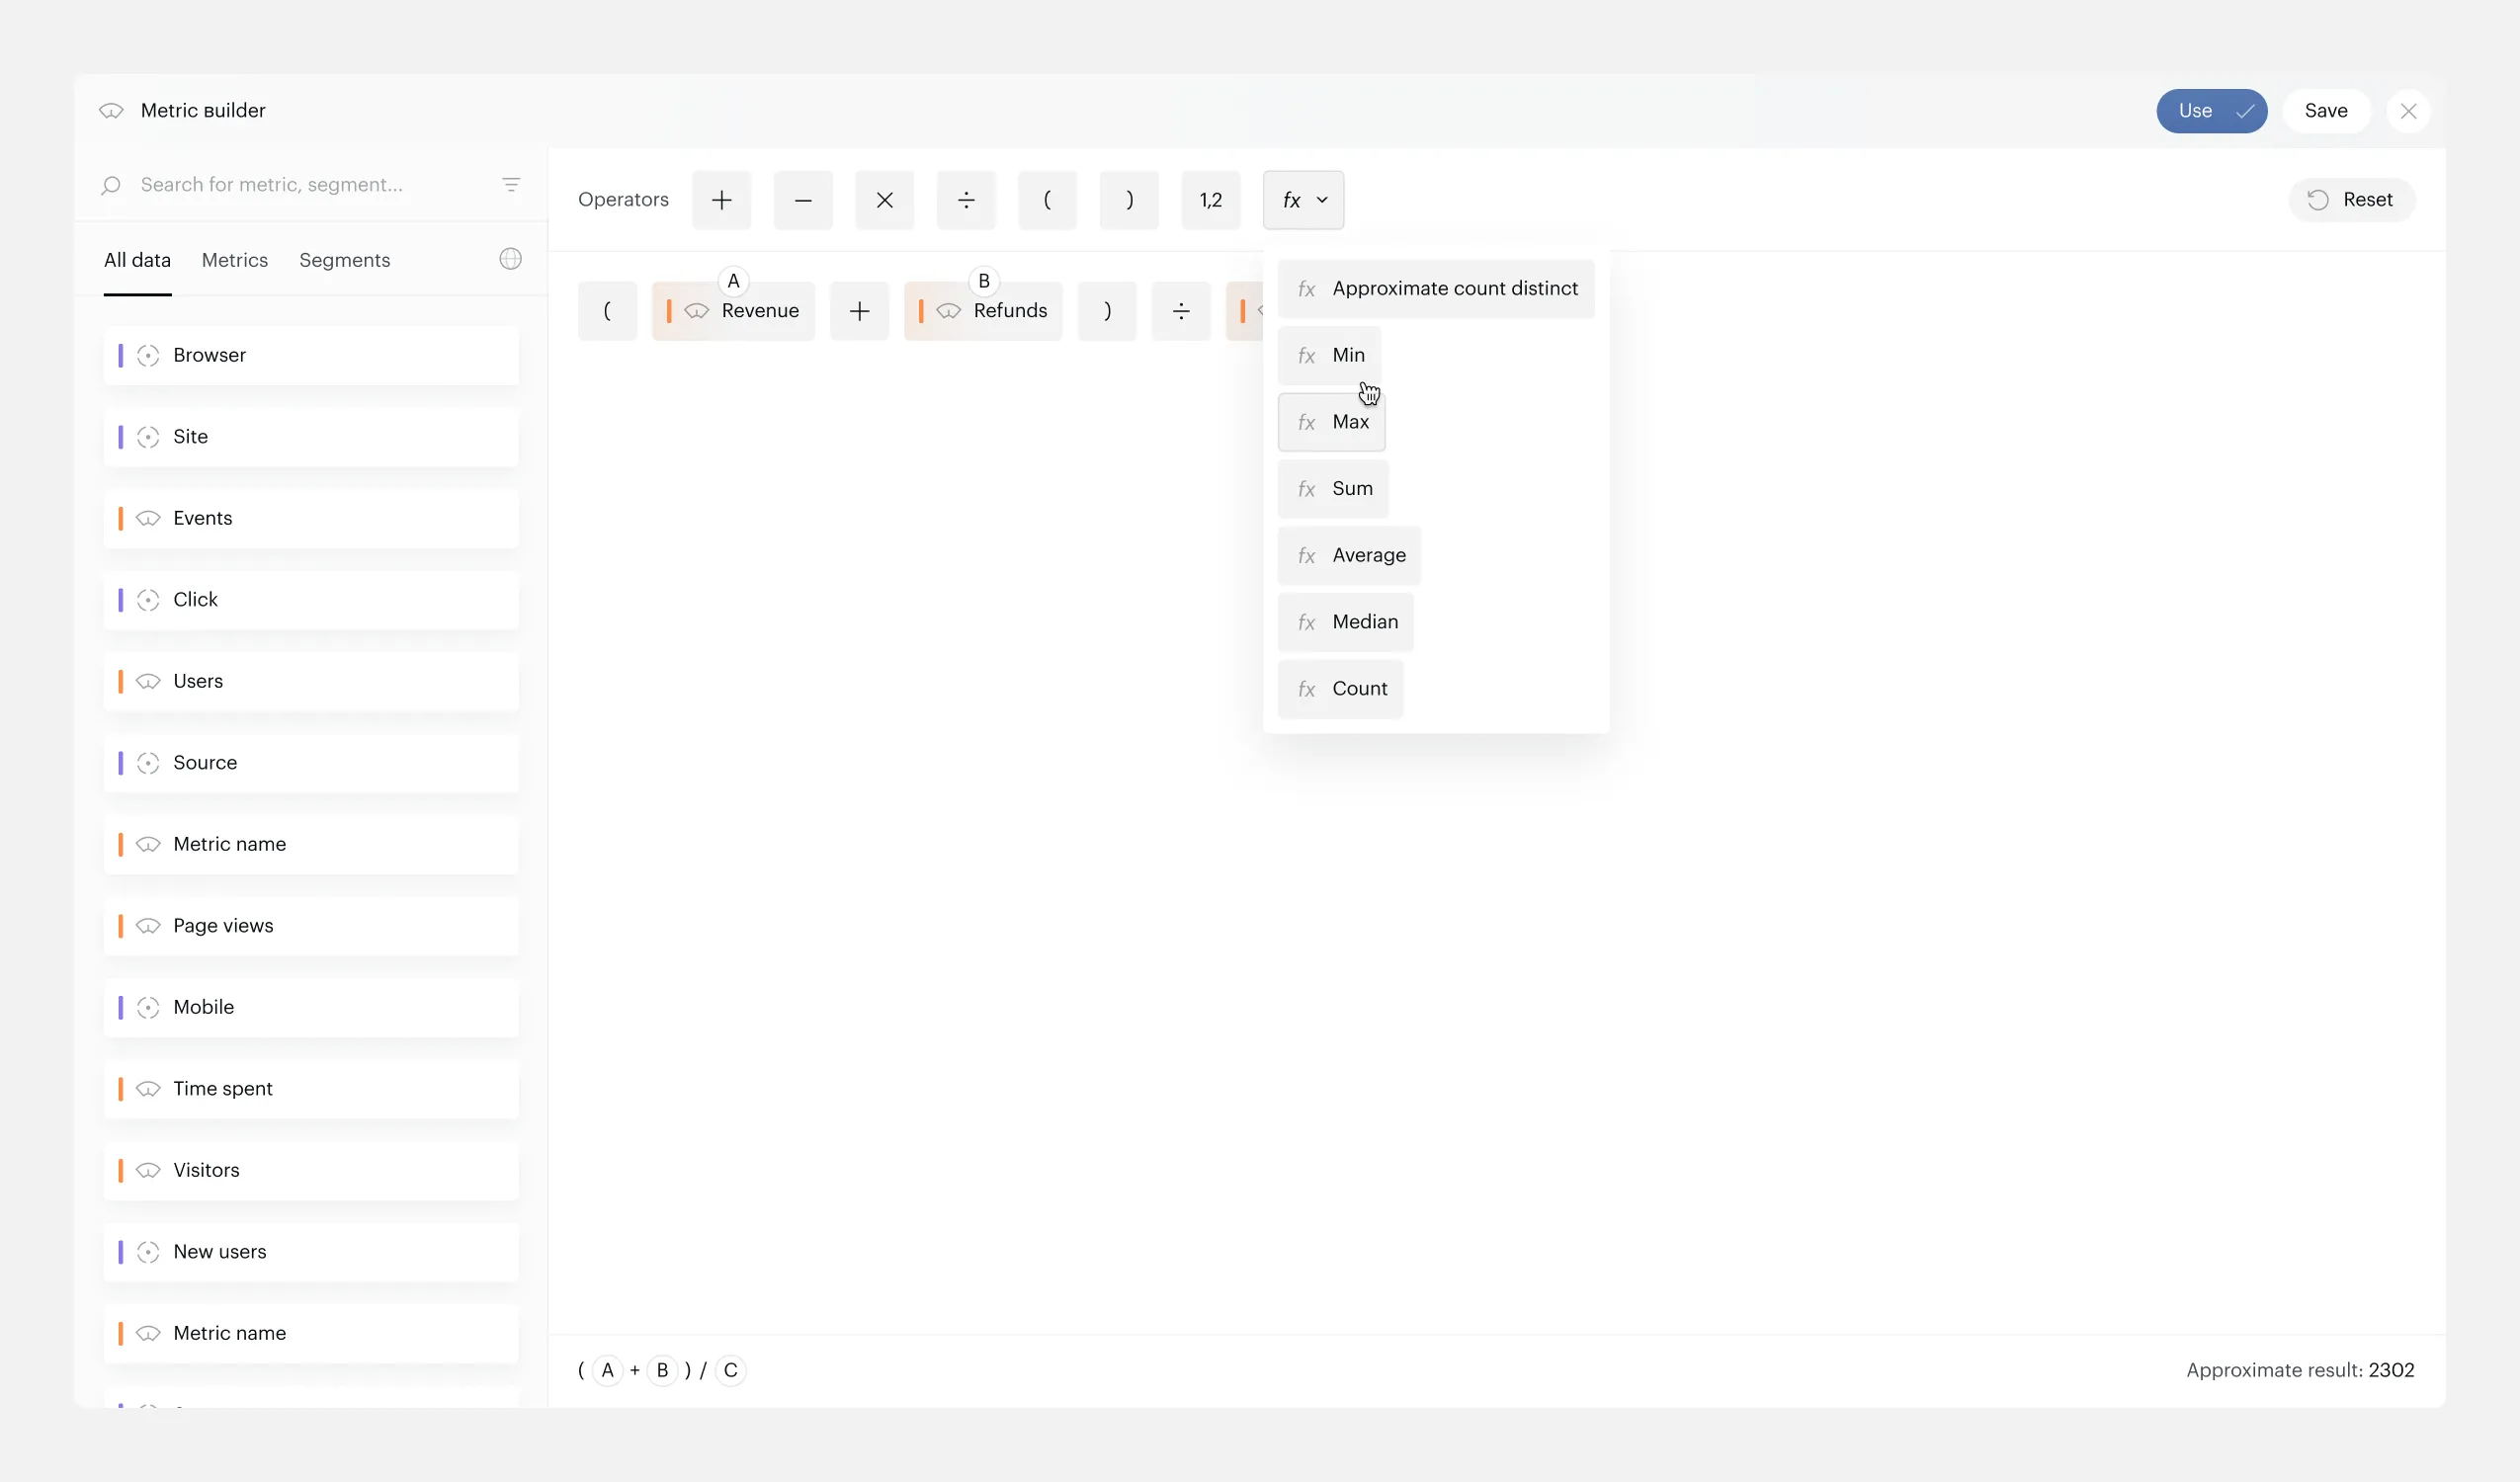
Function dropdown — Min, Max, Sum, Average, Median
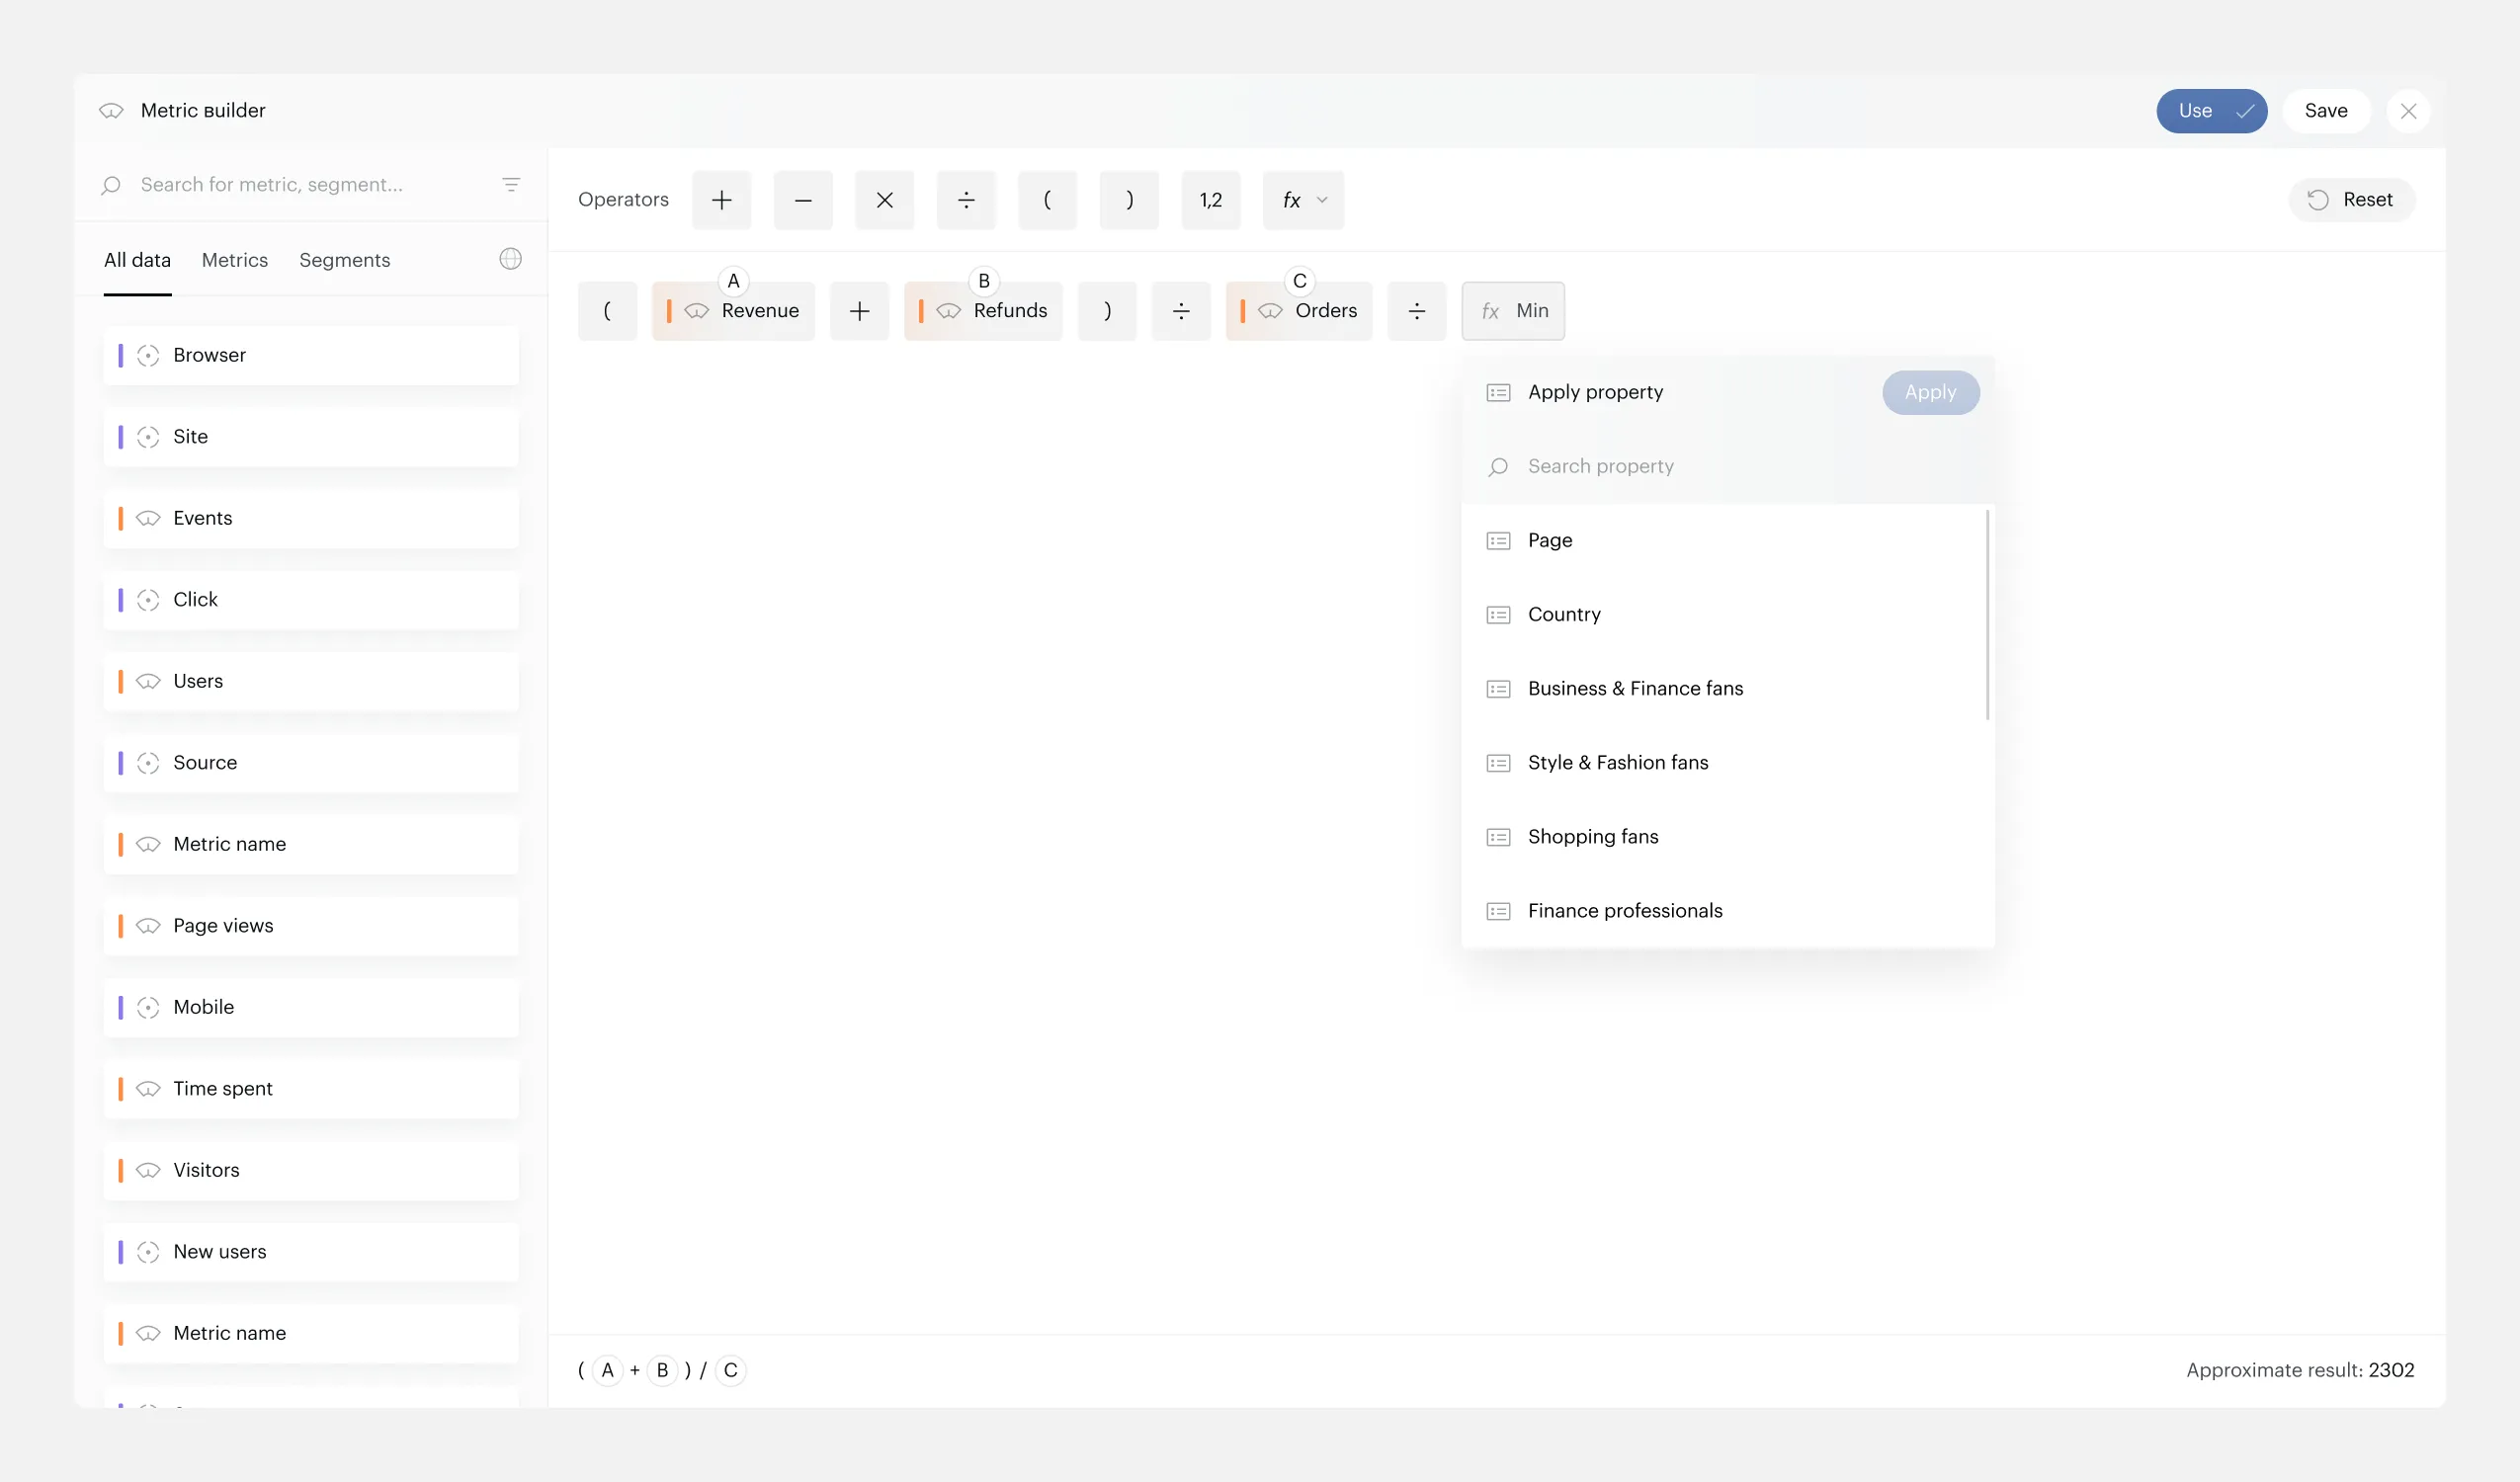
Applying a property to the selected function
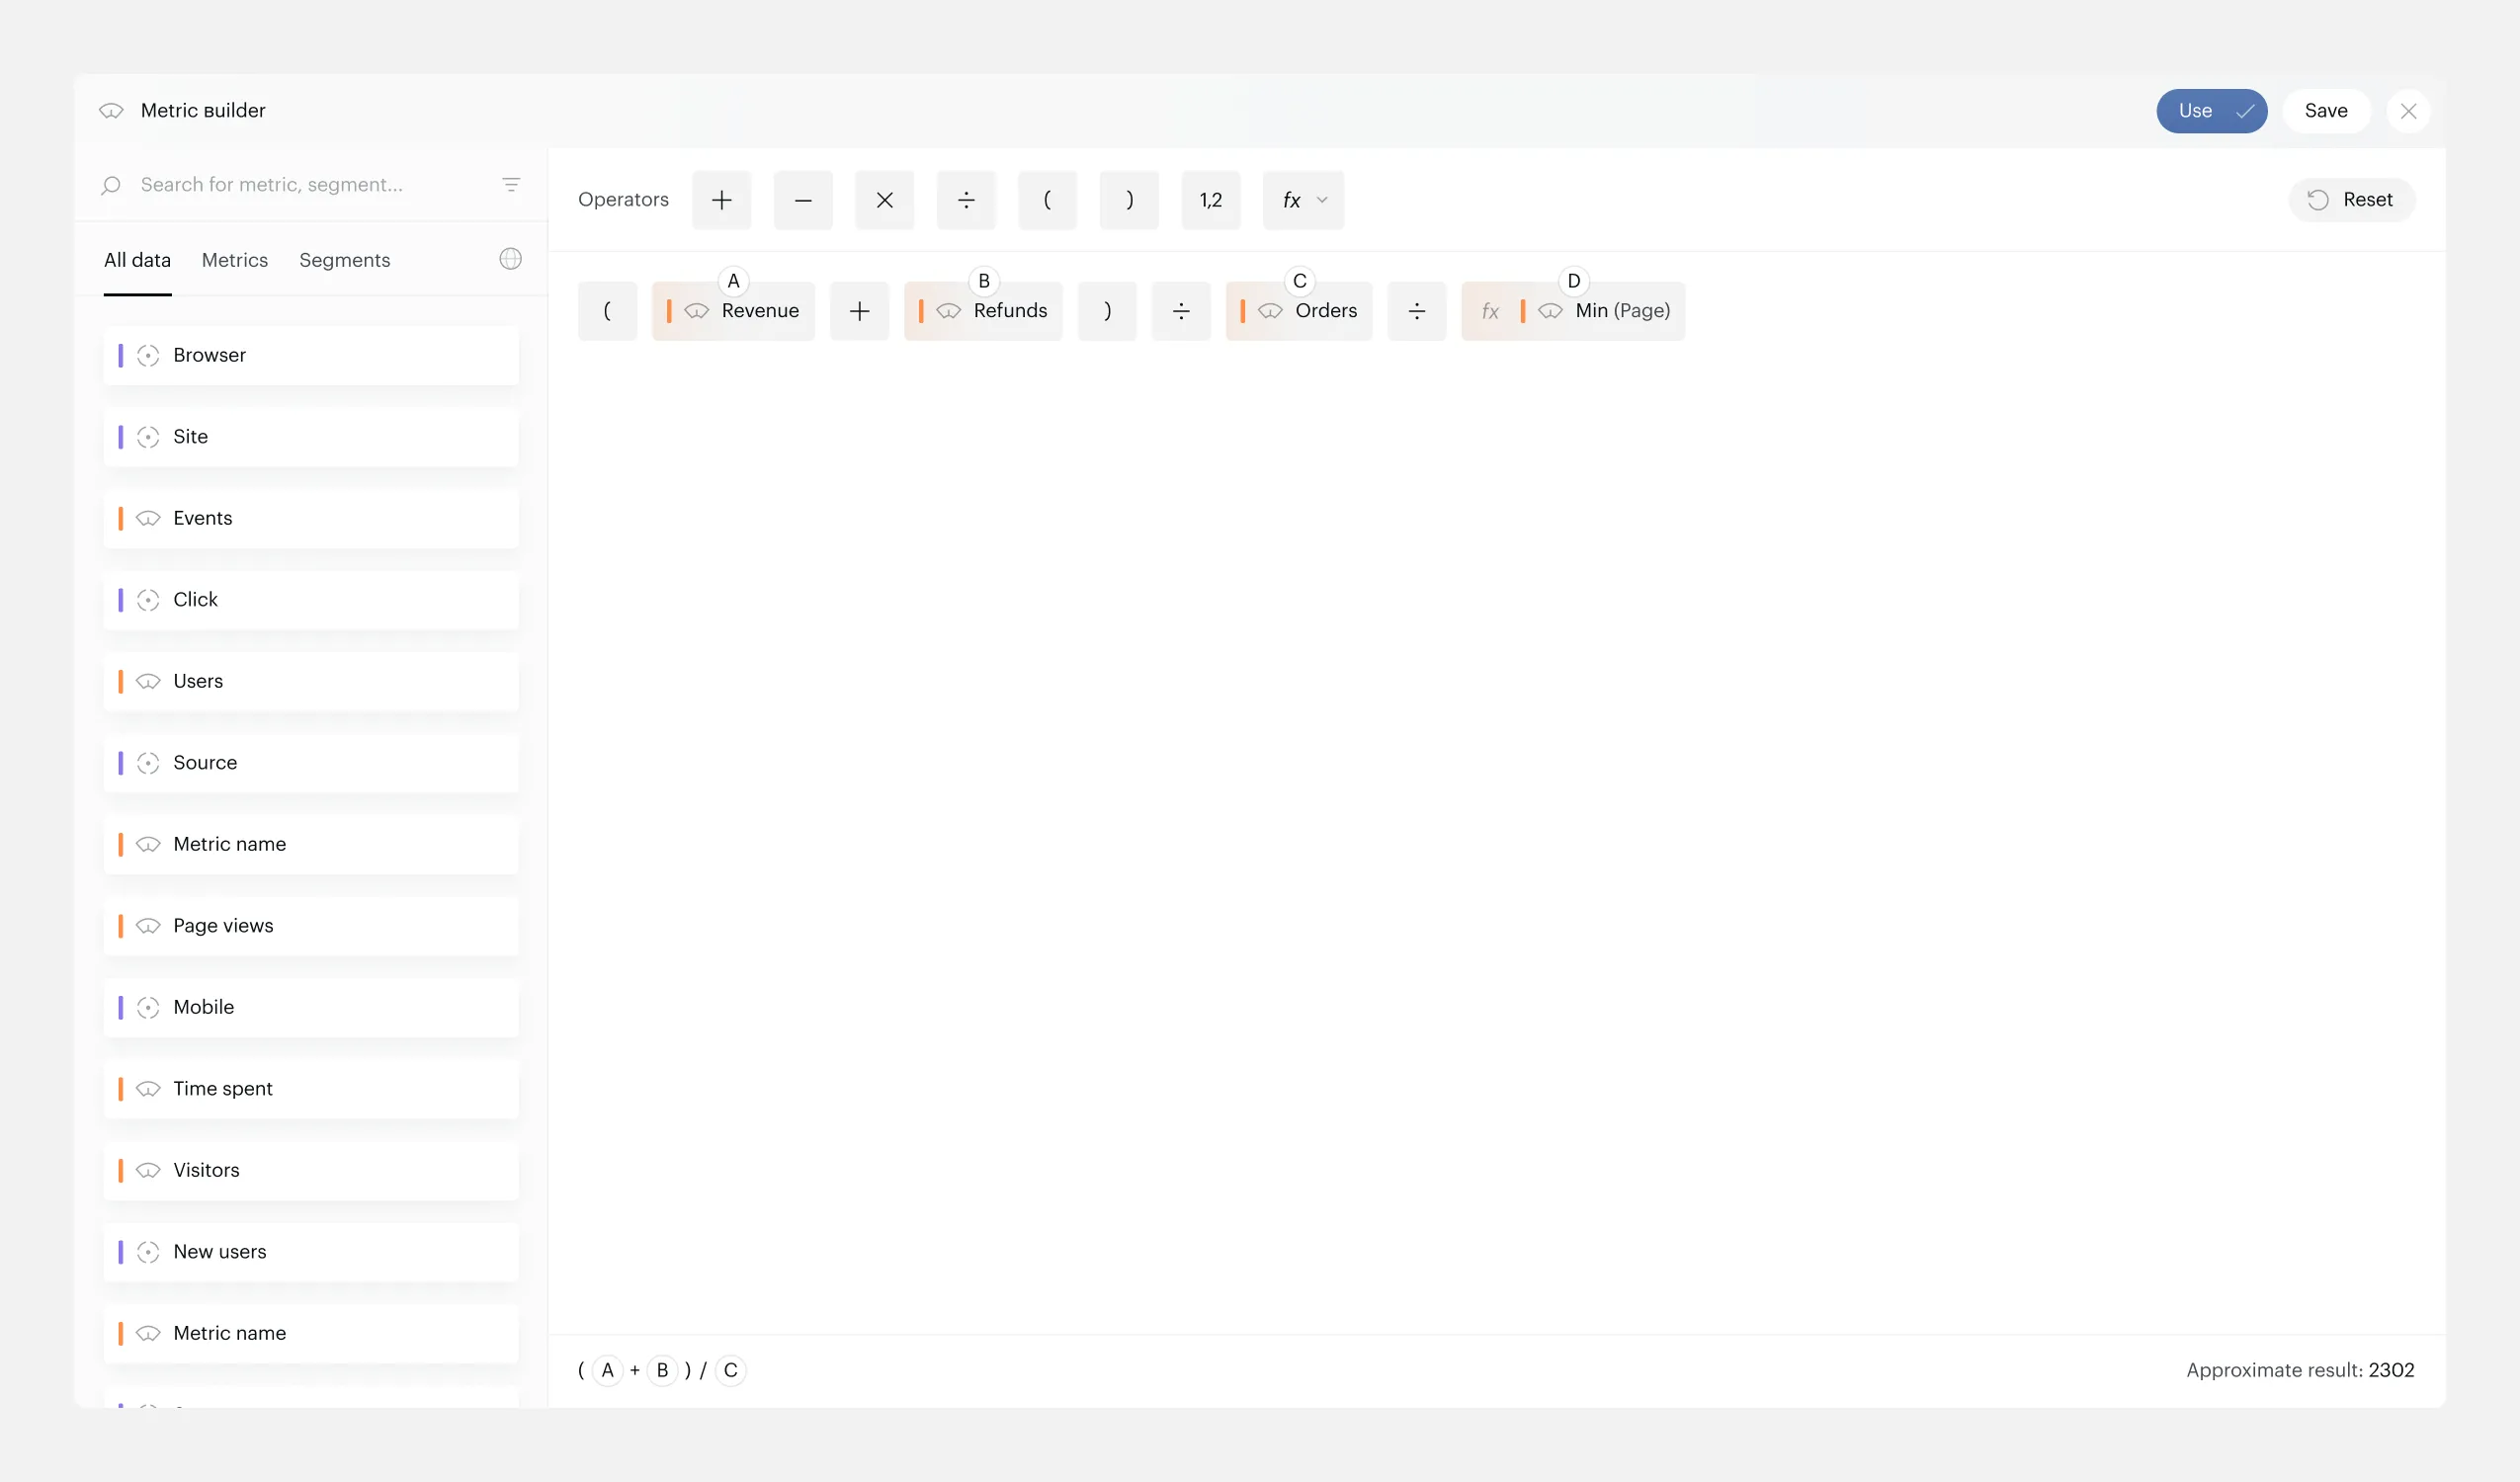
Function-based metric ready — Min applied to a property
Multi-Select and Bulk Actions
Three selection methods: click (single), Shift+click (multi), or marquee selection (drag area). Multi-selected elements get a floating toolbar with bulk actions — Apply Segment or Remove.
Smart logic: Apply Segment is only enabled when the selection contains only metrics or only parentheses. Mixed selections show a tooltip explaining why.
Marquee selection — dragging to select multiple elements
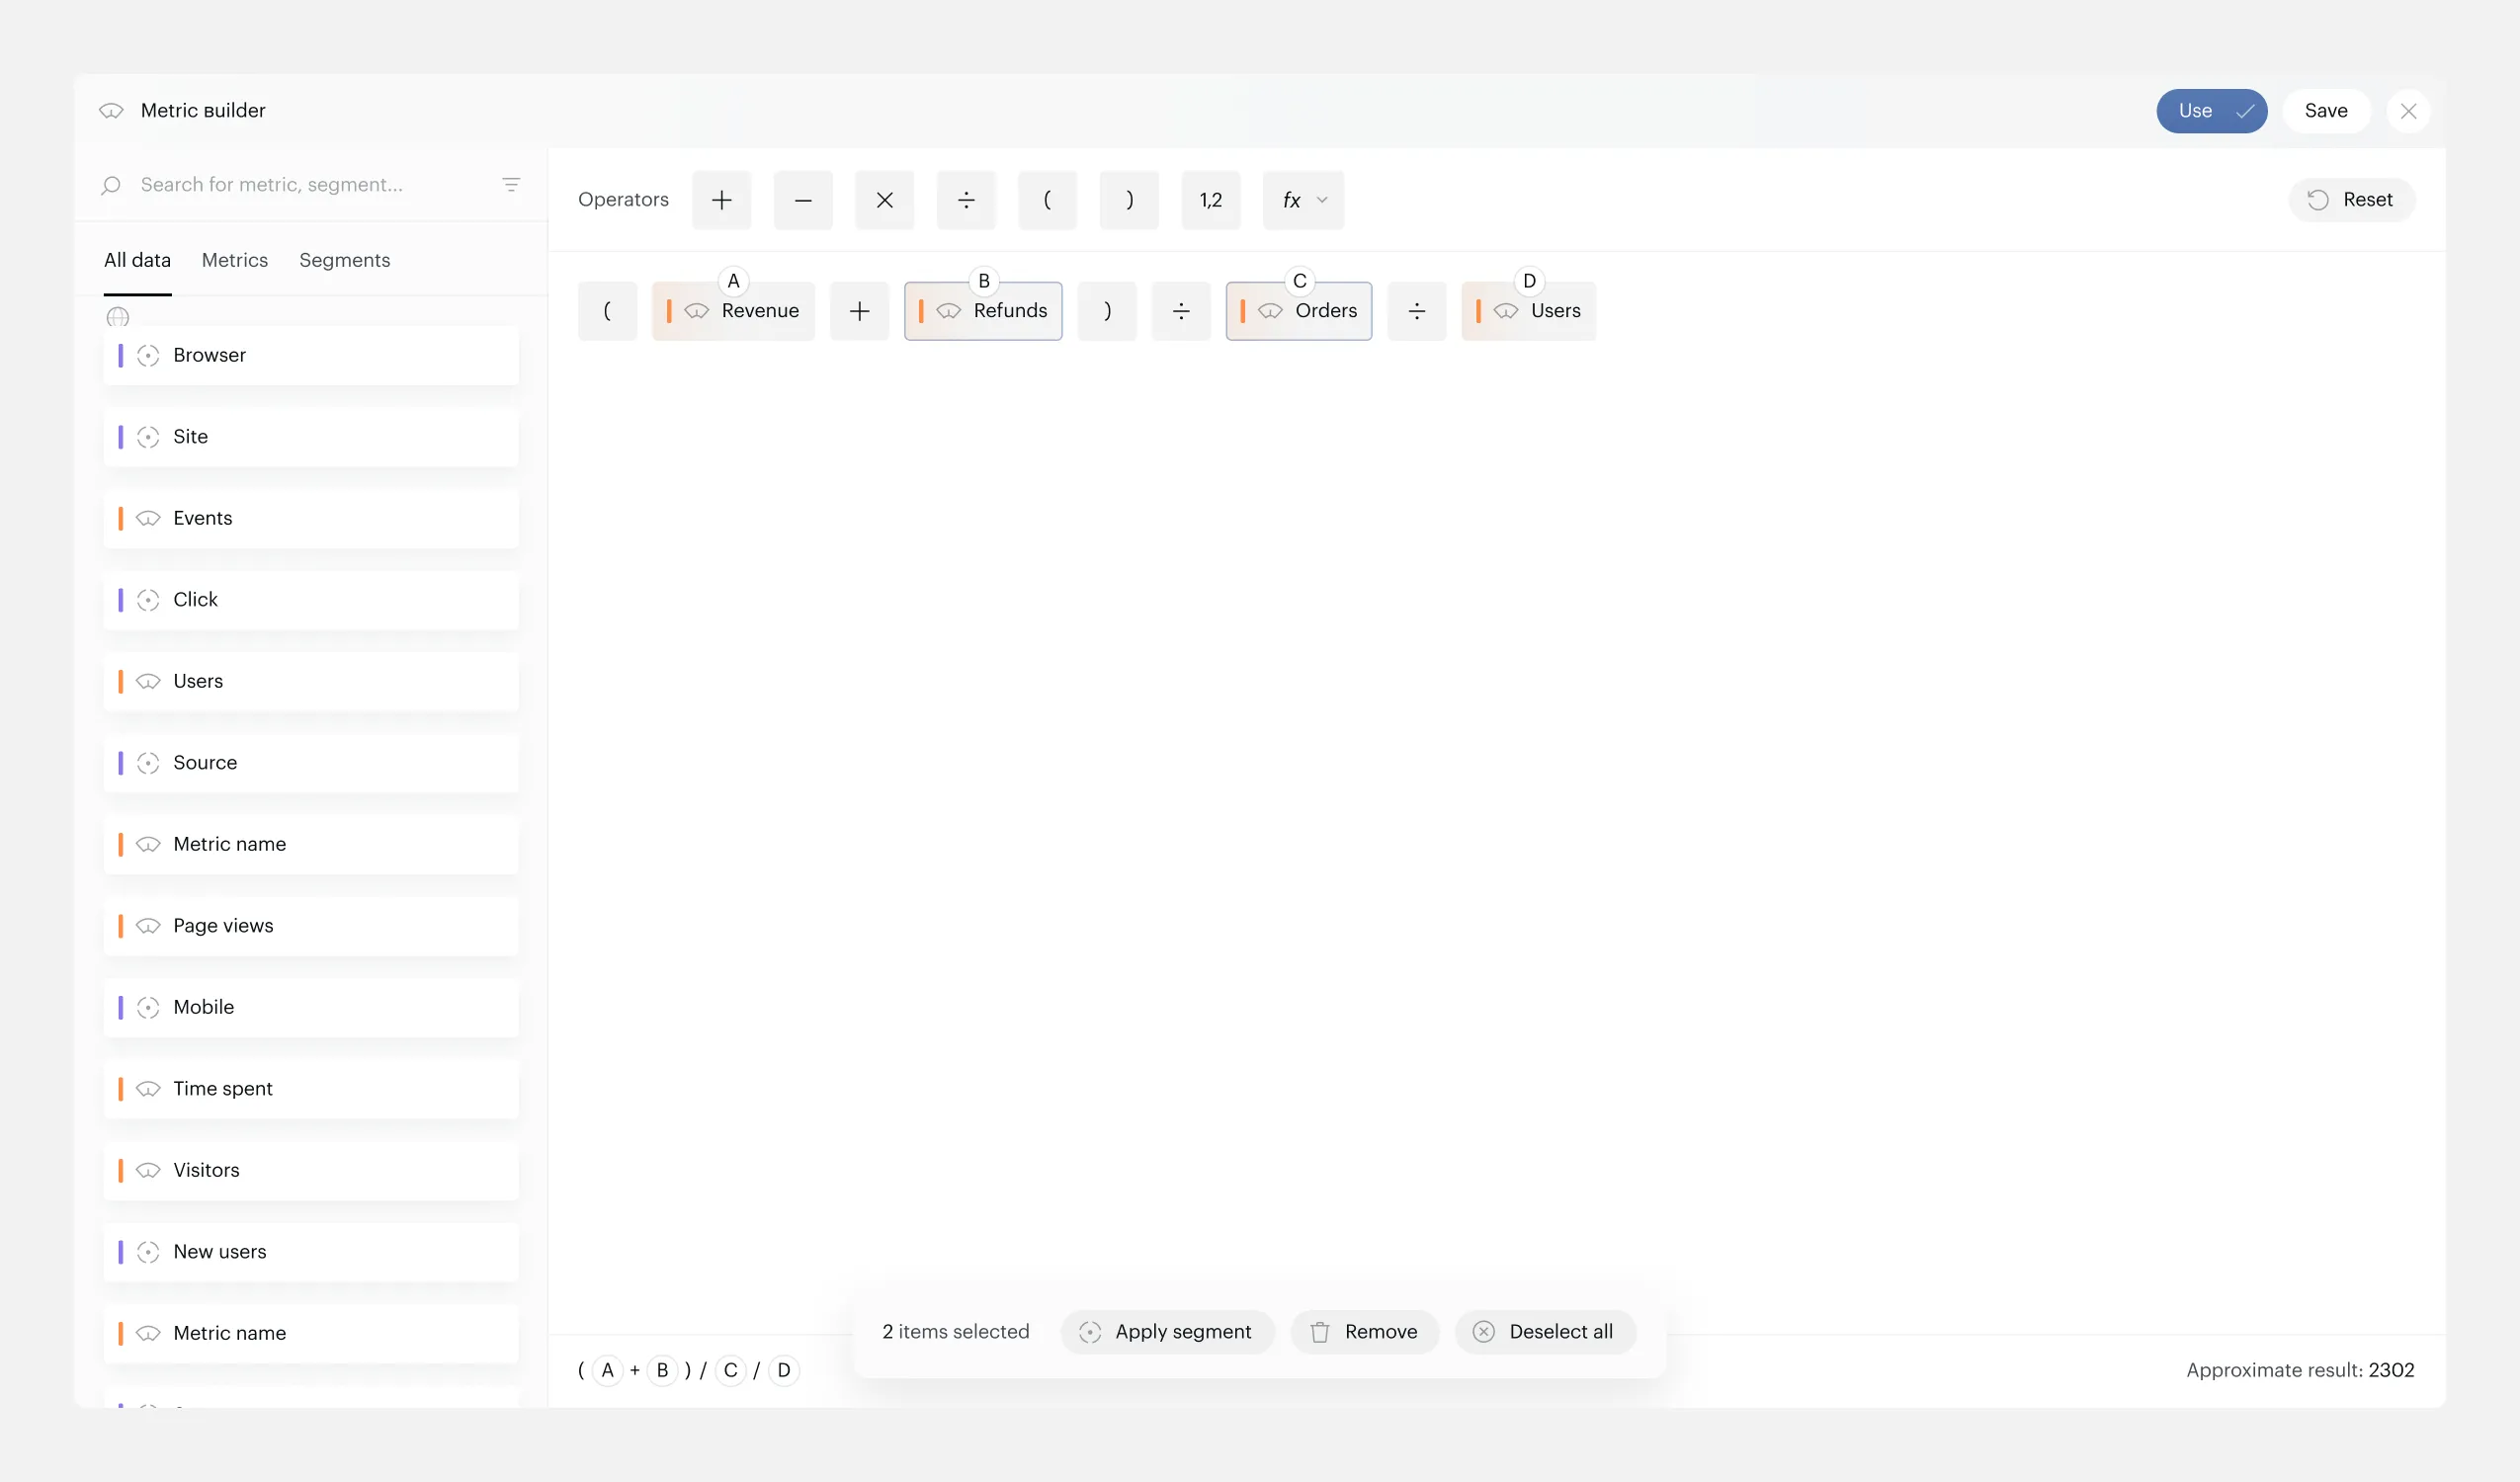
Selected elements with floating toolbar — Apply Segment, Remove
Drag and Drop
Multi-element DnD with position indicators. Dragged elements stay visible at 50% opacity in their original position so you always see where they came from. A 100% opacity line marks where they’ll land. Selection persists after drop.
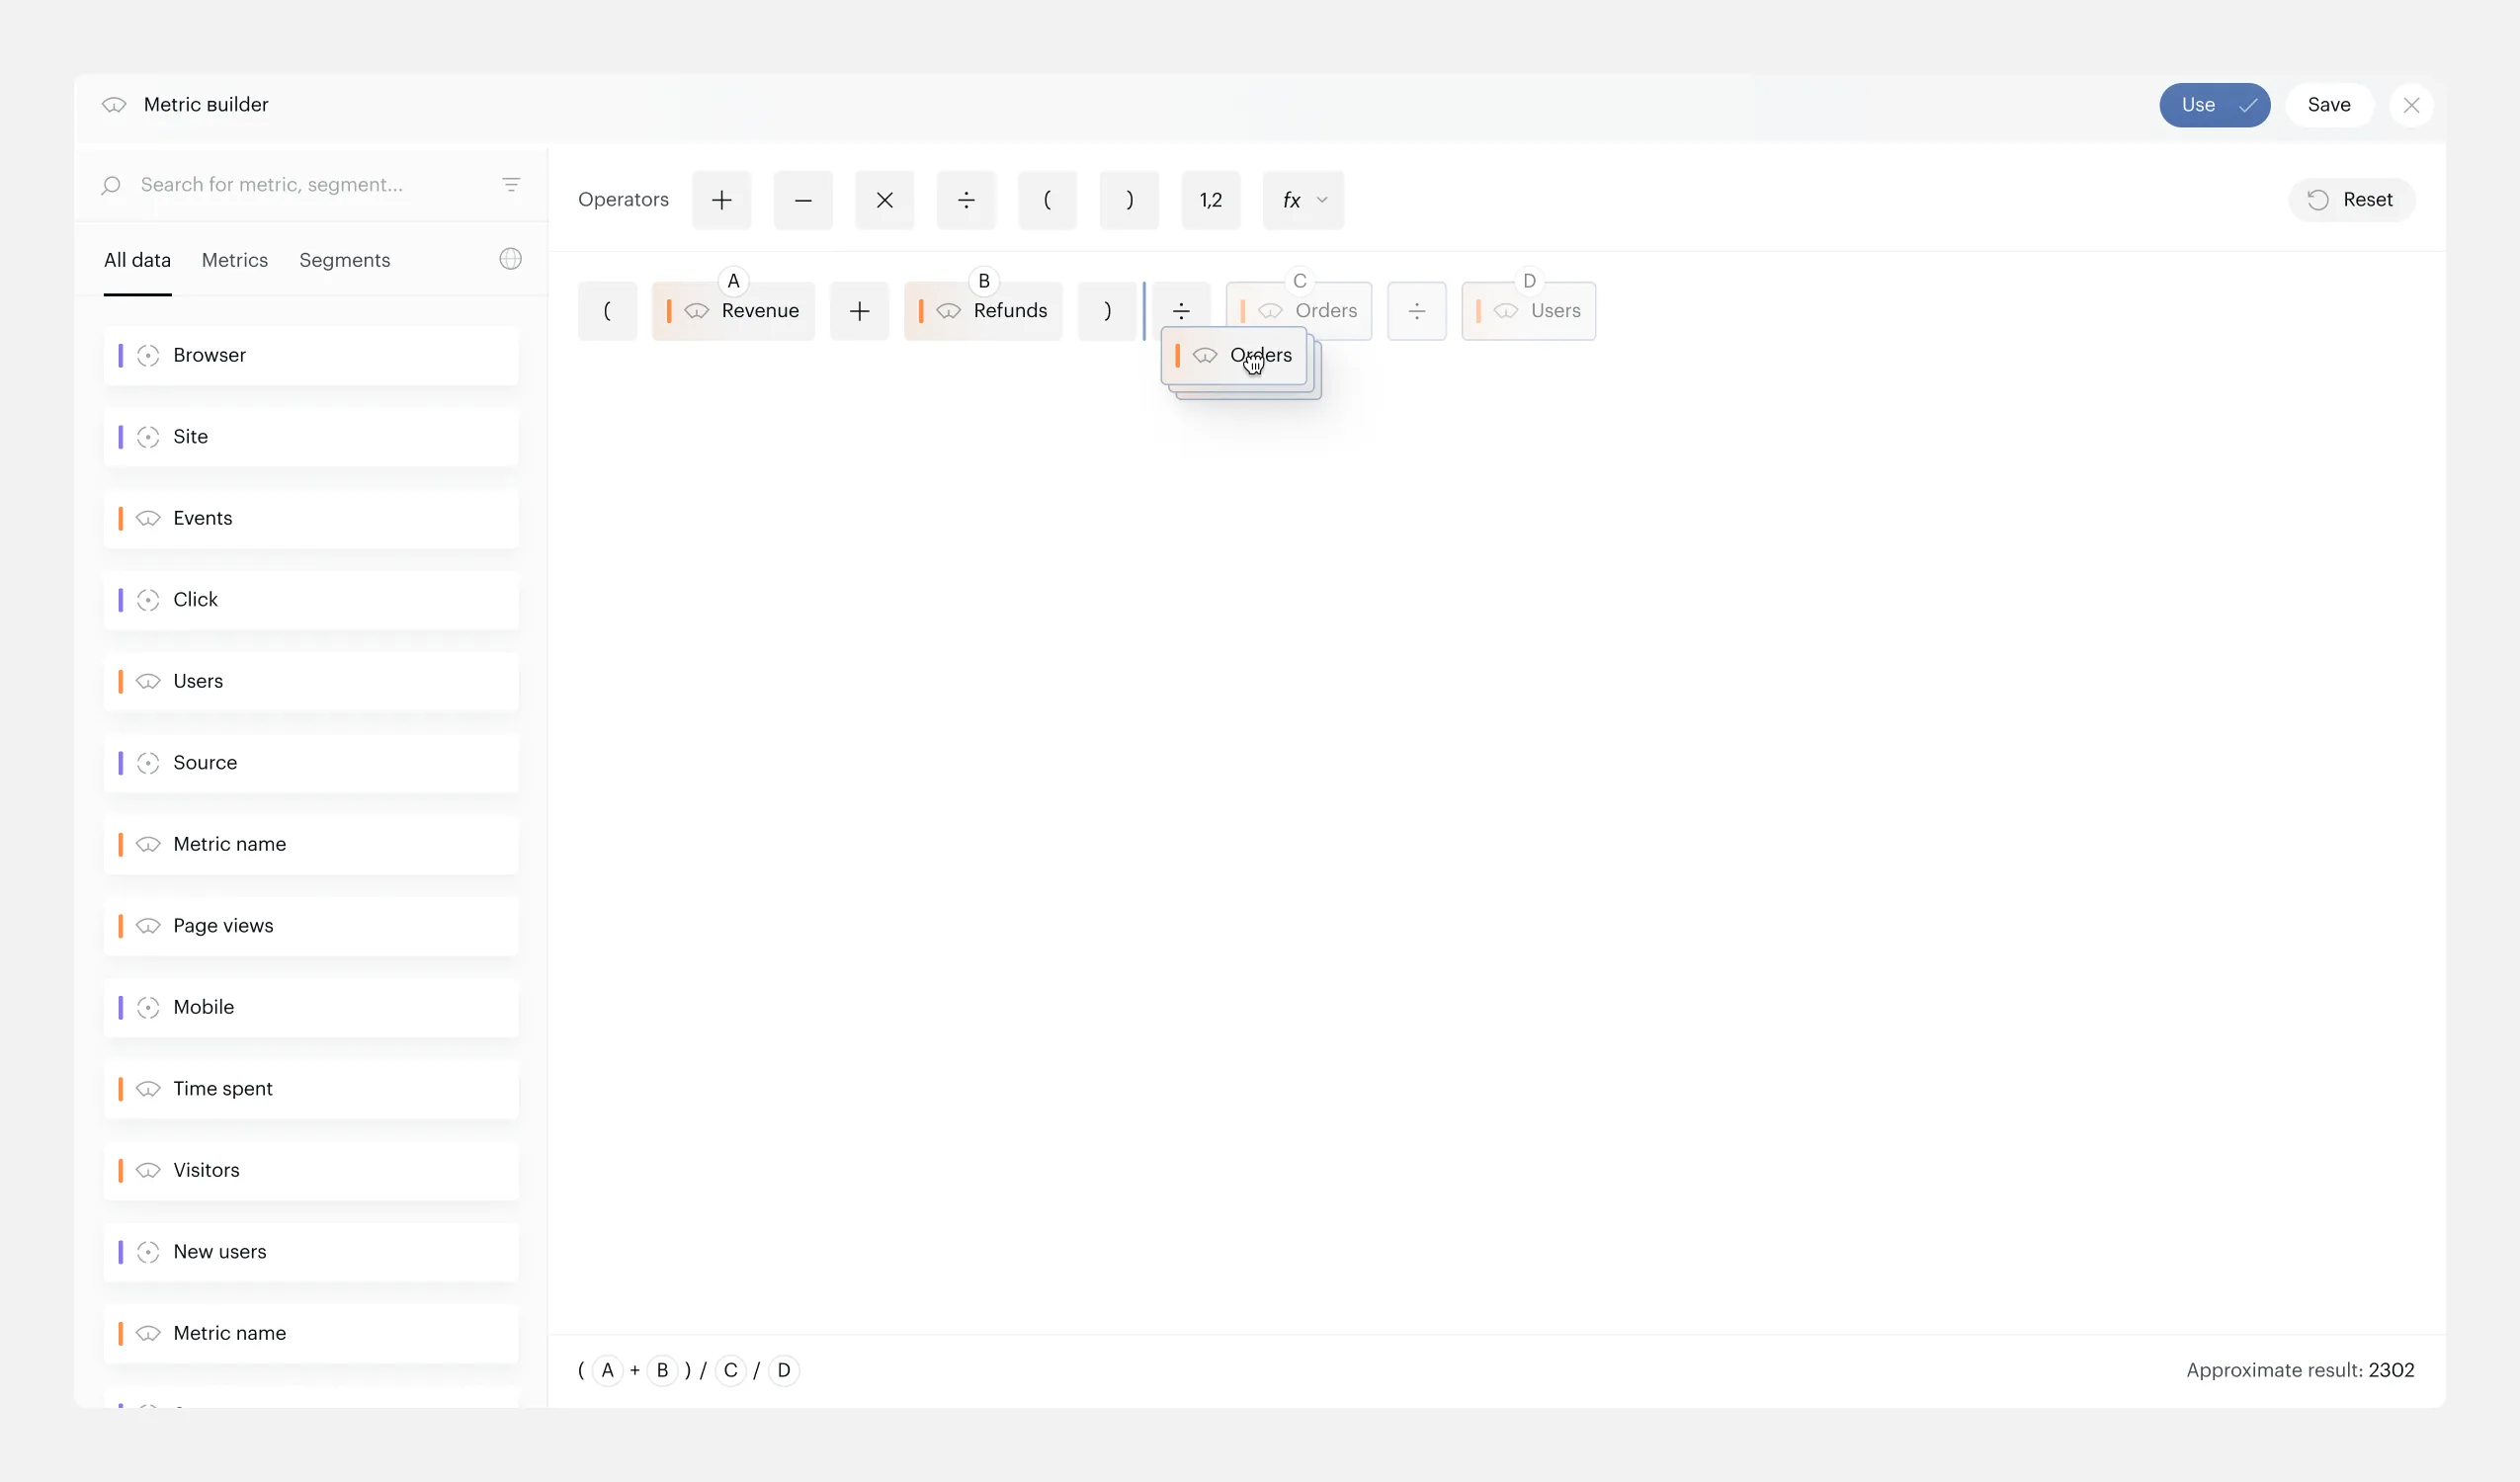
Multi-DnD — dragged elements at 50% opacity, drop indicator at target position
Complex Formulas — Still Readable
Long formulas wrap across multiple lines. Color coding, letter identifiers, and the simplified formula bar keep everything scannable even at scale.
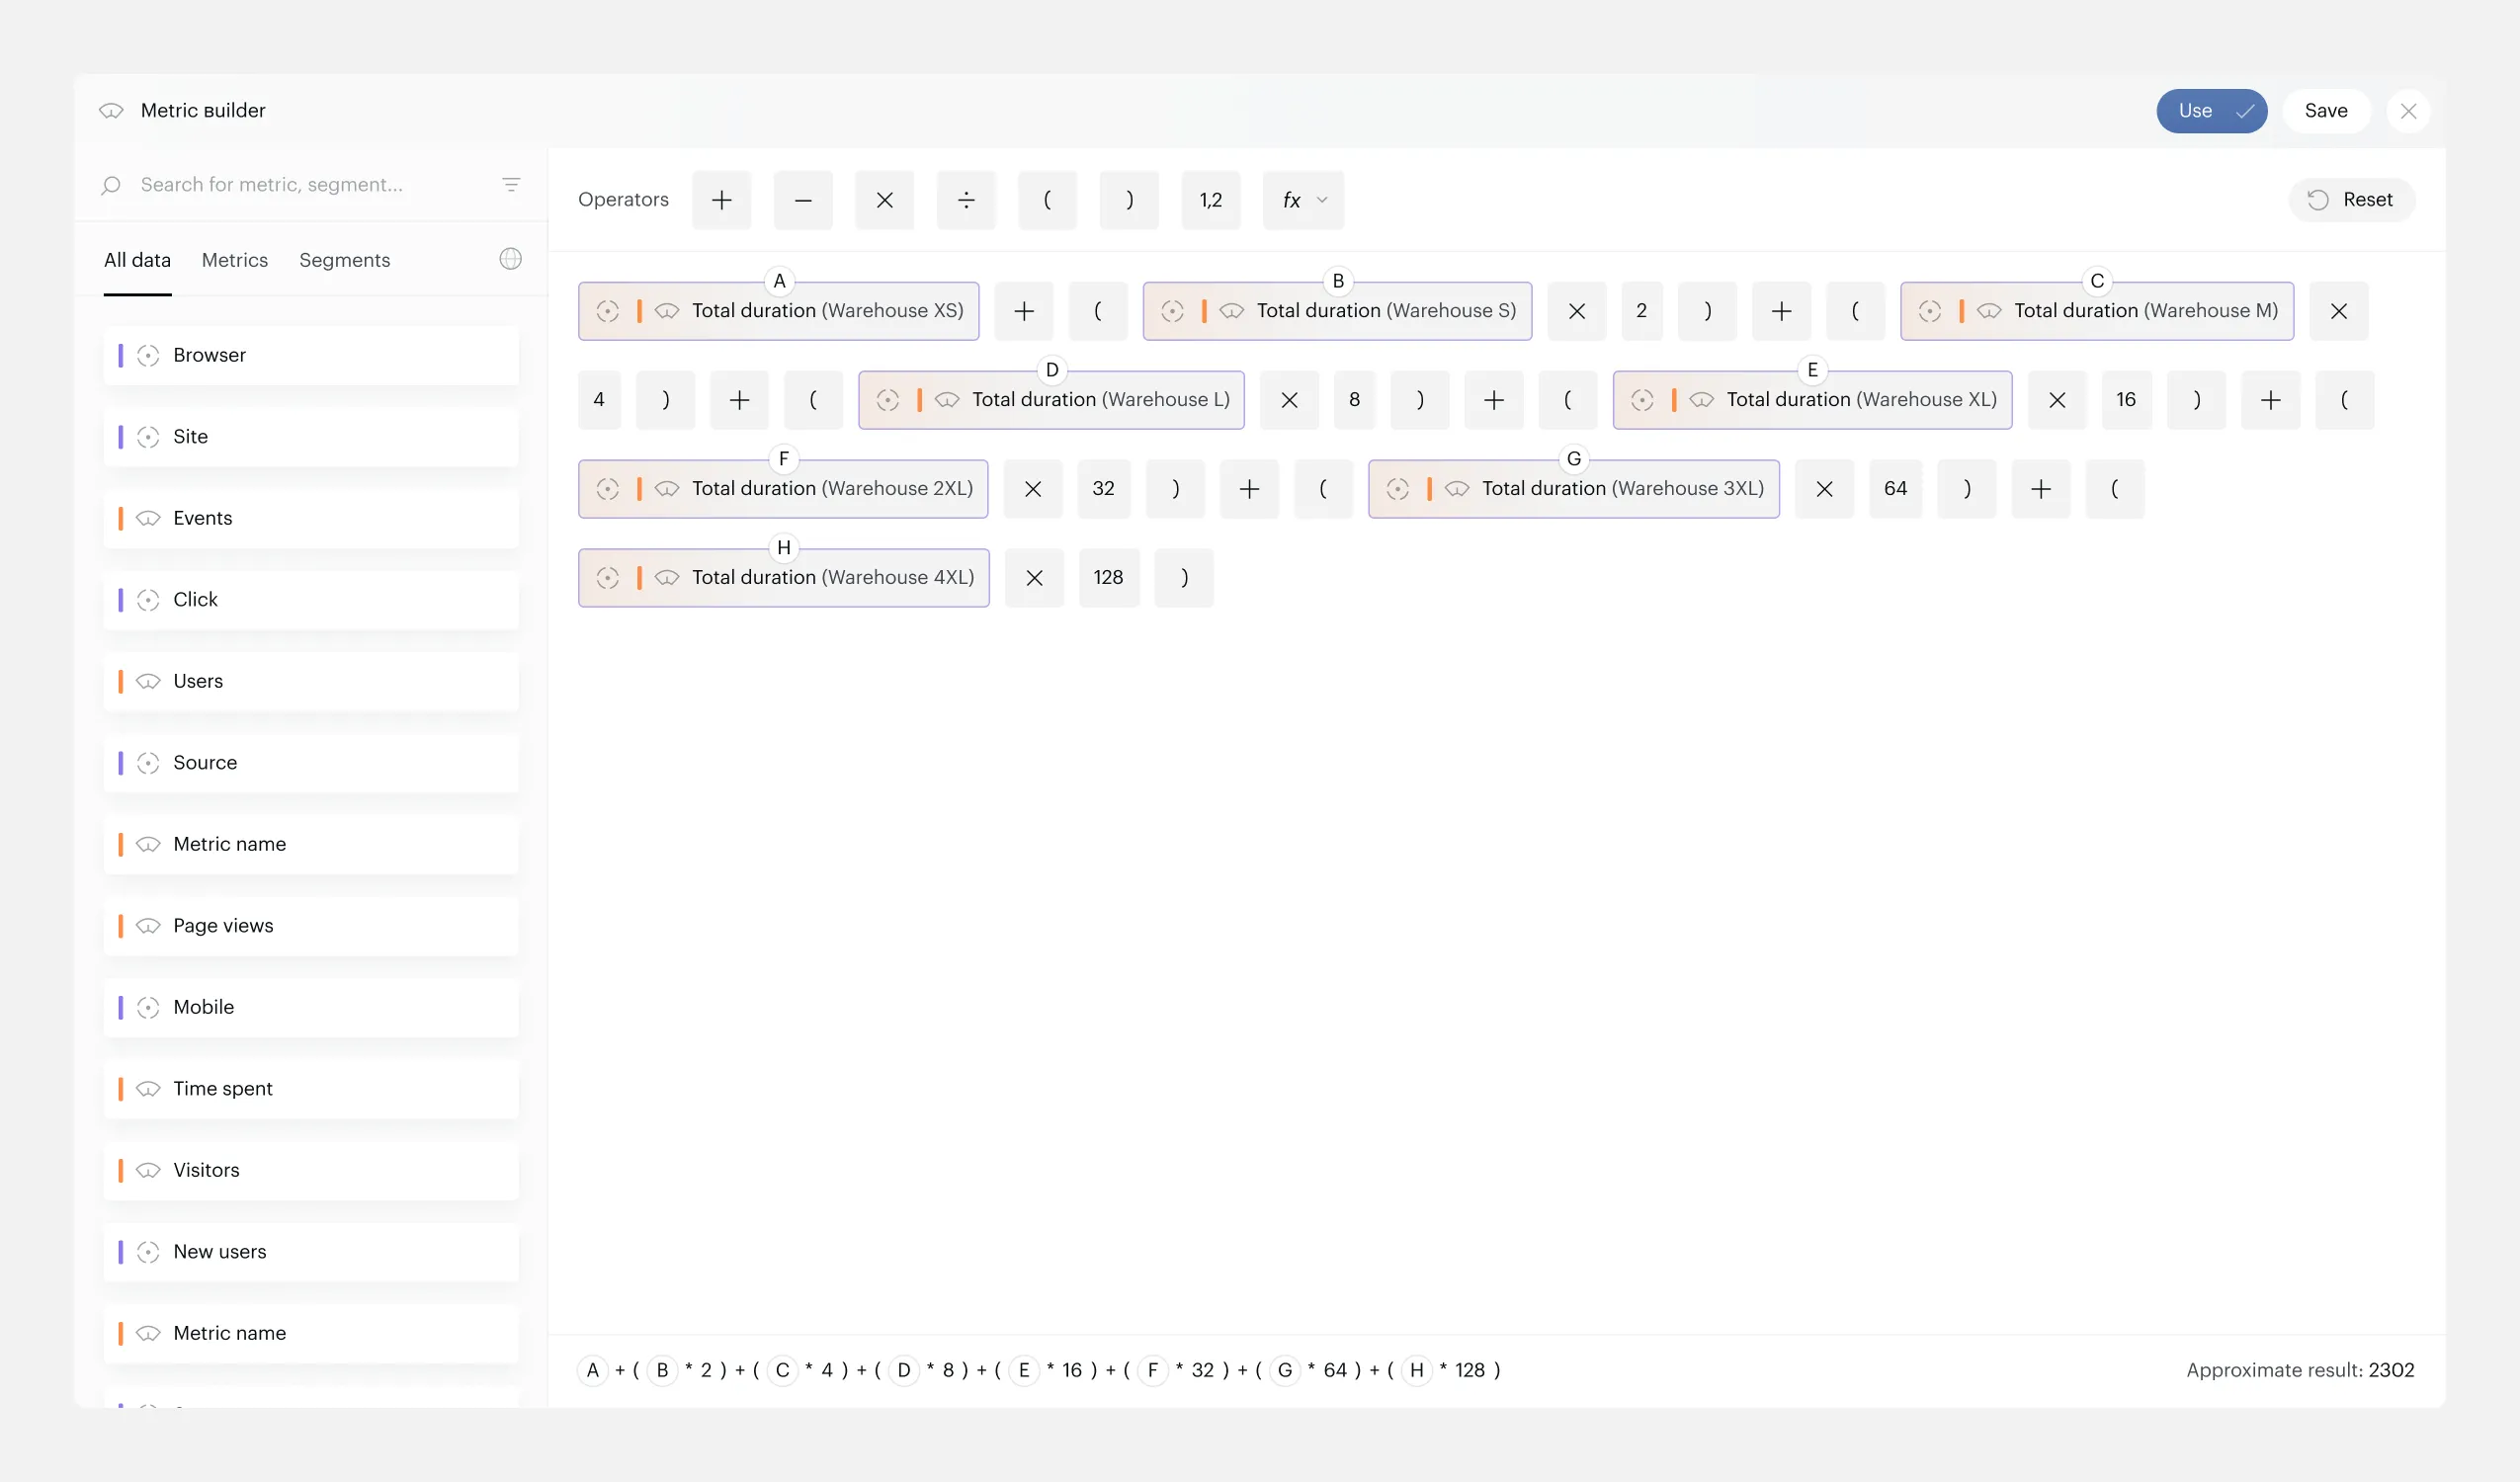
Multi-line formula — readable through color coding and letter identifiers
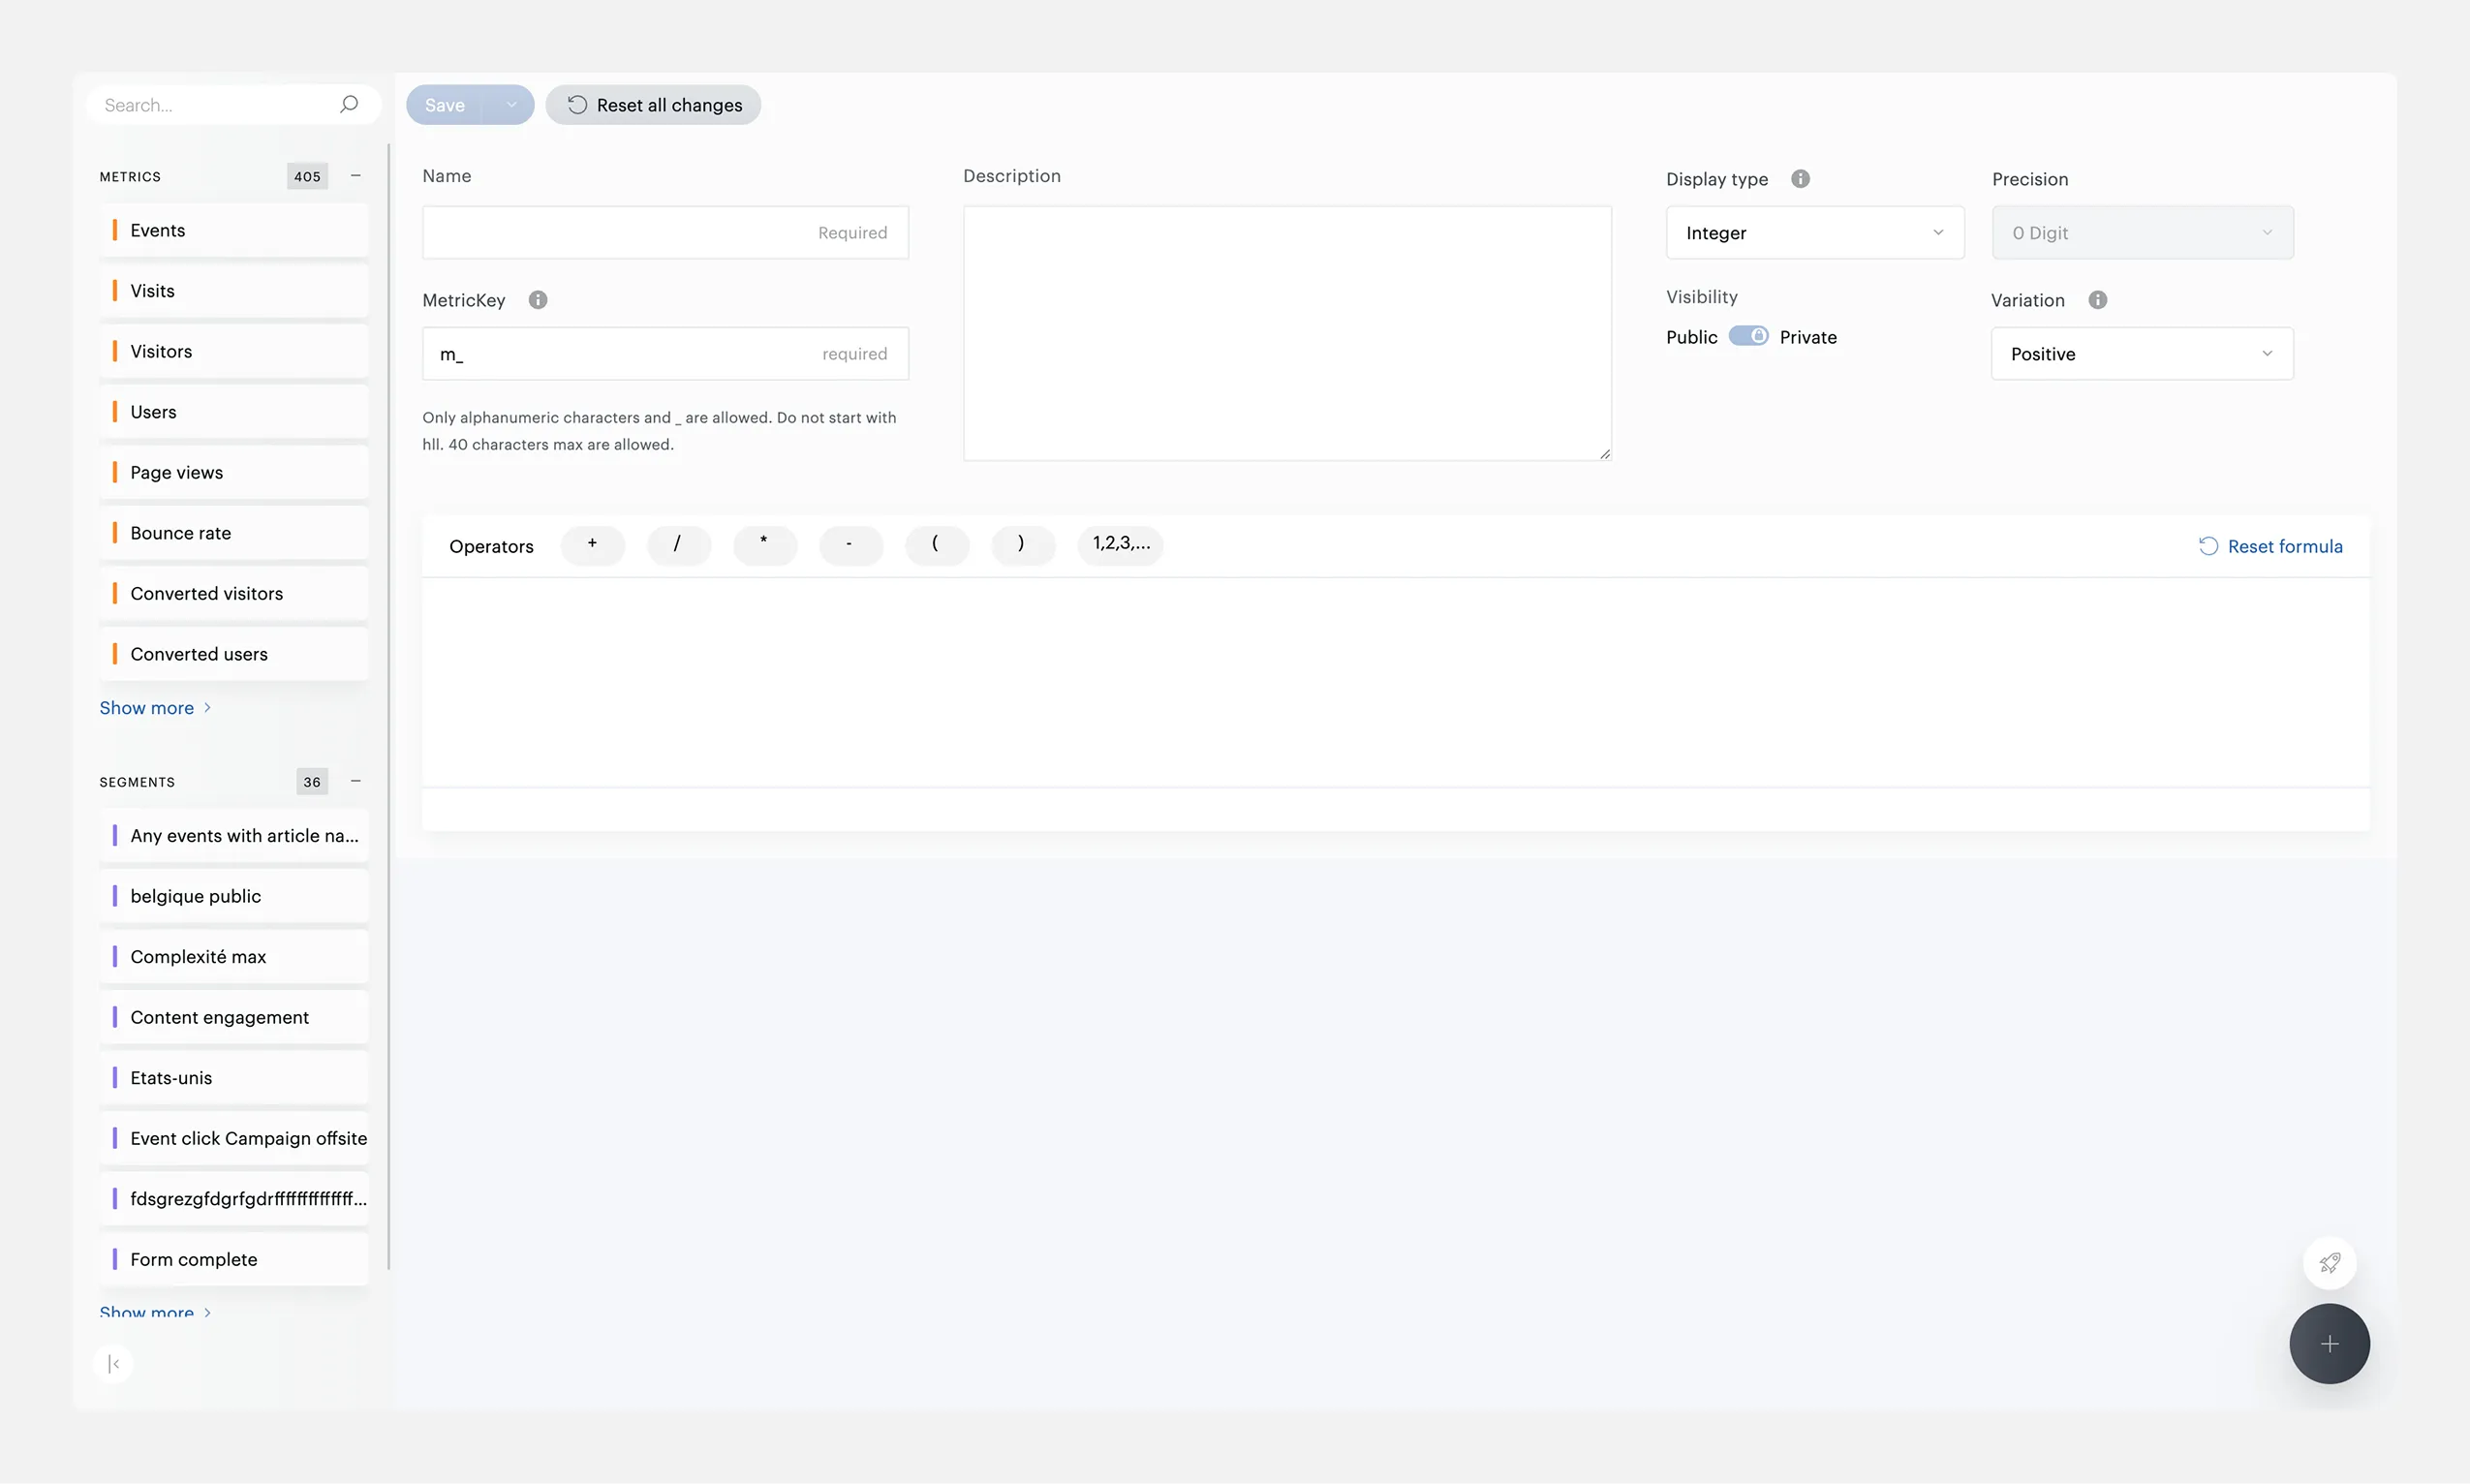
Save Drawer — Metadata When You Need It
Previously, metadata fields (name, key, description, display type, precision) were always visible on screen, taking up space that the formula canvas needed more. I moved them into a drawer that opens only on Save. The canvas gets full width for formula building — metadata appears only when it’s actually relevant.
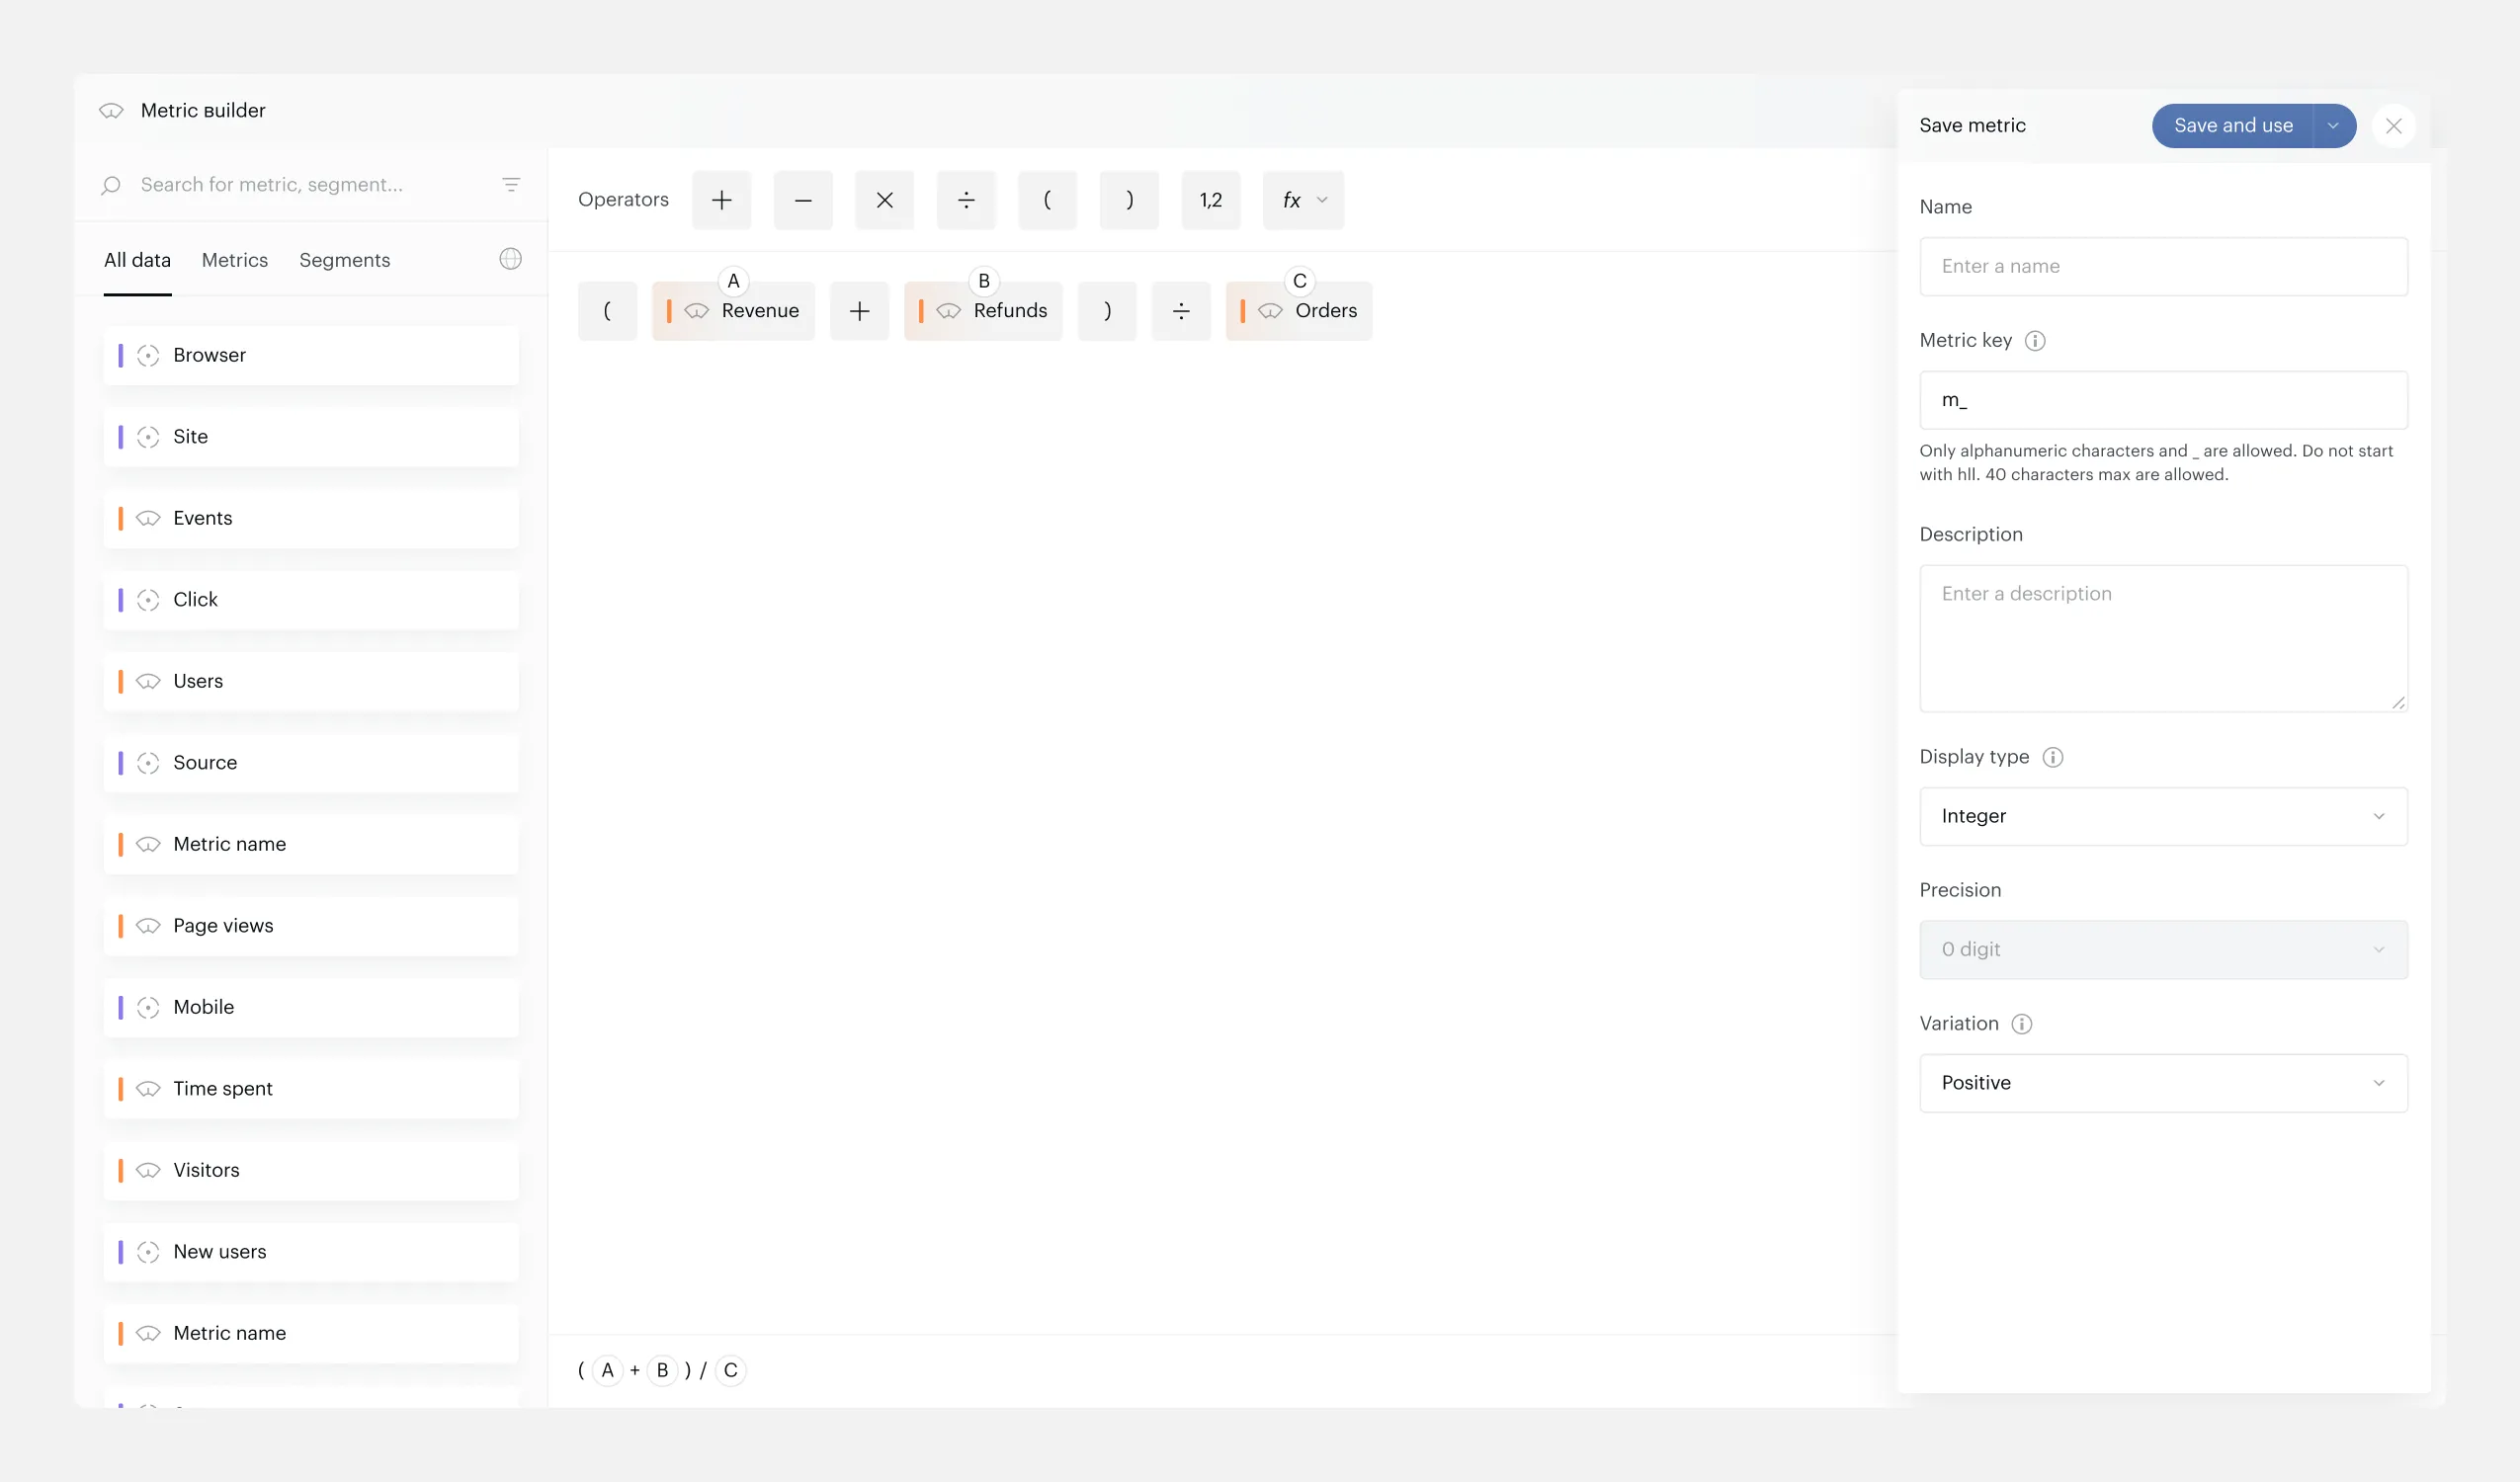
Save drawer — metadata fields hidden until needed
Decisions & Trade-offs
-
Segments on parentheses with conflict warnings: safer than silent override, clearer than blocking without explanation.
-
Single bracket insertion (not auto-pairs): gives users full control over formula structure, validation catches mismatches.
-
Use vs. Save separation: “Use” applies the metric without saving (one-time analysis), “Save” opens a metadata drawer. Different workflows, one interface.
-
Metadata in drawer instead of always visible: formula canvas gets priority — metadata is only needed at save time, not during building.
-
Number chips auto-delete on empty blur: prevents broken formulas from accumulating phantom elements.
Result
- Shipped: segments on parentheses, aggregation functions, multi-select, multi-DnD.
- Positive feedback from both internal team and real users — aggregation functions were the most requested missing feature.
- Before/after: complex metric creation went from a frustrating workaround-heavy process to a direct, visual workflow.
Reflection
In complex interfaces like this, 80% of the work is edge cases — segment conflicts, validation states, empty states. They’re easy to overlook in a spec but they define the real user experience. I made sure to document every scenario in the design file before handoff.